layout:true <div class="header" style="display:block; text-align: left; color:gray; font-size:1em; position: fixed; top: 0px; left: 0px; height: 30px;vertical-align:middle;margin:7px 0 0 0;width:100%;background: #fcfcfc; background: -moz-linear-gradient(top, #fcfcfc 0%, #d1d1d1 100%); background: -webkit-linear-gradient(top, #fcfcfc 0%,#d1d1d1 100%); background: linear-gradient(to bottom, #fcfcfc 0%,#d1d1d1 100%); filter: progid:DXImageTransform.Microsoft.gradient( startColorstr='#fcfcfc', endColorstr='#d1d1d1',GradientType=0 );"> <img src="images/datapolitan_transparent_small.png" style="position: fixed;top: 2px; left: 5px; width: 14%;"> <p style="display:block;text-align:left;color:gray;font-size:1em; position: fixed; top: 0px; left: 155px; height: 30px;vertical-align:middle;margin:7px 0 0 0; ">Data Visualization with Excel</p> </div> <div class="footer" style="display:block;color:gray;position:fixed;bottom: 0px;left:0px;height:30px;vertical-align:middle;margin:0 0 0 0;width:100%;background: #fcfcfc;background: -moz-linear-gradient(top, #fcfcfc 0%, #d1d1d1 100%);background: -webkit-linear-gradient(top, #fcfcfc 0%,#d1d1d1 100%);background: linear-gradient(to bottom, #fcfcfc 0%,#d1d1d1 100%);sfilter: progid:DXImageTransform.Microsoft.gradient( startColorstr='#fcfcfc', endColorstr='#d1d1d1',GradientType=0 );"> <p class="footer"> <span xmlns:dct="http://purl.org/dc/terms/" property="dct:title">Data Visualization with Excel</span> by <a xmlns:cc="http://creativecommons.org/ns#" href="http://www.datapolitan.com" property="cc:attributionName" rel="cc:attributionURL">Richard Dunks, <a href="https://www.linkedin.com/in/elizabeth-diluzio-57794559/" property="cc:attributionName" rel="cc:attributionURL"> Elizabeth DiLuzio</a>, <a href="https://www.linkedin.com/in/jdgodchaux/" property="cc:attributionName" rel="cc:attributionURL">JD Godchaux</a>, and <a href="https://www.linkedin.com/in/bethpappas/" property="cc:attributionName" rel="cc:attributionURL">Beth Pappas</a> is licensed under a <a rel="license" href="http://creativecommons.org/licenses/by-sa/4.0/">Creative Commons Attribution-ShareAlike 4.0 International License</a>.<a rel="license" href="http://creativecommons.org/licenses/by-sa/4.0/"><img alt="Creative-Commons-License" style="border-width:0" src="https://i.creativecommons.org/l/by-sa/4.0/80x15.png" /></a> </p> </div> --- class:center, middle  # Data Visualization in Excel - - - ## Instructors: Elizabeth DiLuzio + Mark Yarish ### Follow along at: http://bit.ly/data-vis-excel #### See the code at: http://bit.ly/data-vis-excel-code <!-- start of A block --> --- class:center,middle # Welcome ??? + Facilitators and TA introduce themselves, establishing mastery but also creating openings for vulnerability and awareness --- # A Few Ground Rules ??? + Facilitators establish the intention we have for the culture of the classroom -- + Step up, step back -- + One mic -- + Be curious and ask questions -- + Assume noble regard and positive intent -- + Respect multiple perspectives -- + Listen to comprehend, not to respond -- + Be present (phone, email, social media, etc.) --- # Introduce Yourself to Your Neighbor + Who are you? + Where do you work? + What do you hope to get from today? + BONUS: What is a visualization that has stuck with you? ??? + An opportunity for participants to get to know each other and settle into the class + We bring them into a positive space related to their work + Facilitator reminds them the data isn't the end but the means to achieve the actions that make us feel good about our jobs --- # What to Expect Today + 9:20 – Data Visualization 101 + 9:45 - Excel Basics + 10:15 – 15 min break + 10:30 – Designing Your Chart + 12:00 – Lunch + 1:00 – Refining Your Story + 1:30 – Applied Practice + 2:15 – 15 min break + 2:30 – Groups Create + Share Presentations + 4:00 – Dismissal ??? + Outline of activities for participants awareness --- # Goals for This Class ??? + An opportunity to set expectations about the topics covered today -- + Learn the four stages of creating an impactful visualization -- + Critically assess different types of charts in Excel -- + Create charts in Excel -- + Get hands-on practice with NYC data -- + Have fun --- # Housekeeping -- + We’ll have one 15 minute break in the morning -- + We’ll have an hour for lunch -- + We’ll have a 15 minute break in the afternoon -- + Class will start promptly after breaks -- + Feel free to use the bathroom if you need during class -- + Please take any phone conversations into the hall to not disrupt the class ??? + Facilitators set expectations for participants --- class:center,middle # Introduction to Data Visualization --- # Data Visualization > When communicating results to non-technical types there is nothing better than a clear visualization to make a point. ##-John Tukey --- # Why do we visualize data? --  --- # Why do we visualize data?  <!-- [](http://nyc.pediacities.com/fsmaps/VisionZero/) http://nyc.pediacities.com/fsmaps/VisionZero/ --> --- # Data Visualization > There are two goals when presenting data: convey your story and establish credibility. ## -Edward Tufte ??? + Presenter asks: thoughts? Agree? Disagree? Additions? + Presenter: all too often, we spit out charts with every piece of data we can think of that could be helpful, vs having a story to share --- # Data Visualization  --- # Four Steps to Creating an Effective Visualization -- + Define your story -- + Choose your charts -- + Refine your visuals -- + Present your story --- class:middle # Step 1: Define Your Story --- # Define Your Story ## There are a few key ingredients: + The audience + A powerful question + The data --- # The Audience -- + Beginner - New to the subject but do not want it overtly elementary -- + Generalist - Aware of the topic and looking for general comprehension broken down into major themes -- + Manager - Seeks an in-depth, actionable understanding of the specifics. They want details. -- + Expert - Needs less storytelling and more details -- + Executives - Have little time, so they want to absorb the significant points with conclusions of weighted probabilities -- ###### [Harvard Business Review](https://hbr.org/2013/04/how-to-tell-a-story-with-data) --- # A Powerful Question + Asked of you from higher up + Something that would be valuable to know in order to make a decision --- # The Data + What data sets do you need to give the full picture? + What data points? --- class:middle > Never underestimate your audience. It’s the most common mistake made by presenters. It is not about you anymore. It’s about your audience’s relationship with your content. ## -Edward Tufte --- # Napoleon's March  .caption[Image Credit: [https://www.edwardtufte.com](https://www.edwardtufte.com), [CC BY-SA 2.0](https://creativecommons.org/licenses/by-sa/2.0/)] --- # Analyzing Napoleon's March + Who's the audience? -- + What's the question? -- + What data was used? -- + Do you find it credible? --- class:middle  [Source](https://www.cnn.com/2019/01/07/europe/woman-knitting-train-delay-scarf-intl-scli/index.html) --- xfcolorad  .caption[Image Credit: [Huffington Post India](https://www.huffingtonpost.in/2016/06/14/how-india-eats_n_10434374.html), [CC BY-SA 2.0](https://creativecommons.org/licenses/by-sa/2.0/)] ---  .caption[Image Credit: [Sports Center](https://www.facebook.com/SportsCenter/photos/a.166942843324566/2173658729319624/?type=3&theater), [CC BY-SA 2.0](https://creativecommons.org/licenses/by-sa/2.0/)] --- class:middle,center # A Quick (Re-)Introduction to Excel --- # Benefits of Excel -- + Easy to use -- + Very visual -- + Lots of features and functions -- + Easy to make charts -- + Does a lot of formatting for you --- # Drawbacks of Excel -- + Not very intuitive -- + Hard to find what you’re looking for (and they keep moving things around) -- + Lots of features and functions -- + Easy to make (bad) charts -- + Does a lot of formatting for you --- class:middle,center # A Quick (Re-)Introduction to Excel ## [Click to download the data](data/DOT_complaints.xlsx) <!-- # Exercise 1: simple exercises to create charts --> --- # PivotTable -- + A data summarization tool for quickly understanding and displaying the data you’re analyzing -- + We often use summary counts to create charts. -- ## TO START: Make sure you don't have a range selected --  --- # Creating a PivotTable  + Excel will default to all your data + You'll generally create a PivotTable in a new sheet --- # PivotTable  --- # PivotTable + Click and drag columns (called "fields") into the boxes + Boxes labeled "Filter", "Row Labels", "Column Labels", "Values"  --- # Create a Bar Chart + "Insert" ribbon -> clustered column chart  --- # Create a Bar Chart  --- # What questions do you think someone would have about the data? ??? + Walk participants through the stages + When it comes time to decide on the question, remind them that, to make the day more interesting, they should chose a more complex problem with multiple steps -- + 3 minutes to brainstorm questions on your own -- + 3 minutes to share and consolidate your questions with your group -- + 3 minutes to decide on a few questions your group will answer today --- # Exploratory Data Analysis -- + Goal -> Discover patterns in the data -- + Understand the context -- + Summarize fields -- + Use graphical representations of the data -- + Explore outliers -- ####Tukey, J.W. (1977). Exploratory data analysis. Reading, MA: Addison-Wesley --- # Exploring the Data ??? + Facilitator releases participants to explore the data on their own + Facilitator helps participants with any issues analyzing the data + Participants practice presentation skills and articulating their analysis to a group + Facilitators emphasize telling a story with data -- + Take a moment to begin answering your questions -- + Utilize PivotCharts as you explore -- + Work in pairs, groups, or on your own -- + Create new tabs to answer each question -- + Be prepared to share what you found and the steps you took to find it -- + We'll be around to help --- class:center,middle # 15 Minute Break --- # Four Steps to Creating an Effective Visualization + <span style="color:gray">Define your story</span> + Choose your charts + <span style="color:gray">Refine your visuals</span> + <span style="color:gray">Present your story</span> --- class:center,middle # One Data Point --- # One Data Point  .caption[Image Credit: [https://www.cbc.ca](https://www.cbc.ca/news/canada/saskatchewan/drinking-age-will-remain-19-in-saskatchewan-1.1350523), [CC BY-SA 2.0](https://creativecommons.org/licenses/by-sa/2.0/)] -- + What's the story? -- Is this chart effective in conveying the message? --- # One Data Point ## There are a few popular options to show one data point: -- + Single number -- + Waffle chart -- + Donut or pie chart --- # Single Number  ??? + What's the story? Is this chart effective in conveying the message? --- # Waffle Chart  ??? + What's the story? Is this chart effective in conveying the message? --- # Donut Chart  ??? + What's the story? Is this chart effective in conveying the message? --- class:center,middle # Two or More Data Points --- # Two or More Data Points  .caption[Image Credit: [https://www.samhsa.gov](https://www.samhsa.gov/data/sites/default/files/2016_National_Mental_Health_Services_Survey.pdf), [CC BY-SA 2.0](https://creativecommons.org/licenses/by-sa/2.0/)] ??? + Thoughts on chart? Constructive criticism? --- # Two or More Data Points  --- # Two or More Data Points  --- class:middle > There is no data that can be displayed in a pie chart, that cannot be displayed better in some other type of chart. ## -John Tukey --- # Pie Charts  ??? + Facilitator prompts participants to identify the largest slices in each pie chart --  "Piecharts". Licensed under [CC BY 1.0](https://creativecommons.org/licenses/by/1.0/legalcode) via [Wikimedia Commons](http://commons.wikimedia.org/wiki/File:Piecharts.svg#/media/File:Piecharts.svg) with modifications ??? + Comparing the results, it's clear the difficulty discerning nearly similar quantities --- # Two or More Data Points  --- # Two or More Data Points ## There are a few popular options to show two or more data points: -- + Column or bar charts -- + Clustered column or bar charts -- + Stacked bar or 100% stacked bar charts --- class:center,middle # Change Over Time --- # Change Over Time -- ## The most popular way to show change over time is a line chart --- # Change Over Time  ??? + Constructive feedback? --- class:center,middle # Creating Charts in Excel --- # Create a Pie Chart   --- # Create a Pie Chart  + Add data labels --- # Create a Pie Chart + Add data labels  + Format the data labels --  --- # Create a Pie Chart  --- # Create a Donut Chart  --   --- # Create a Horizontal Bar Chart   --- # Create a Horizontal Bar Chart 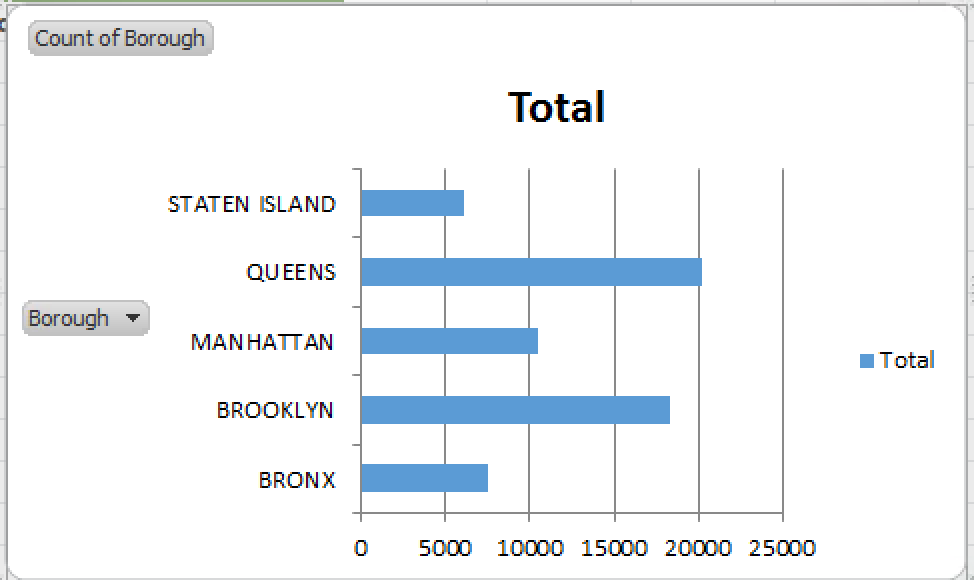 --- # Create a Horizontal Bar Chart + Change the data to `complaint type` 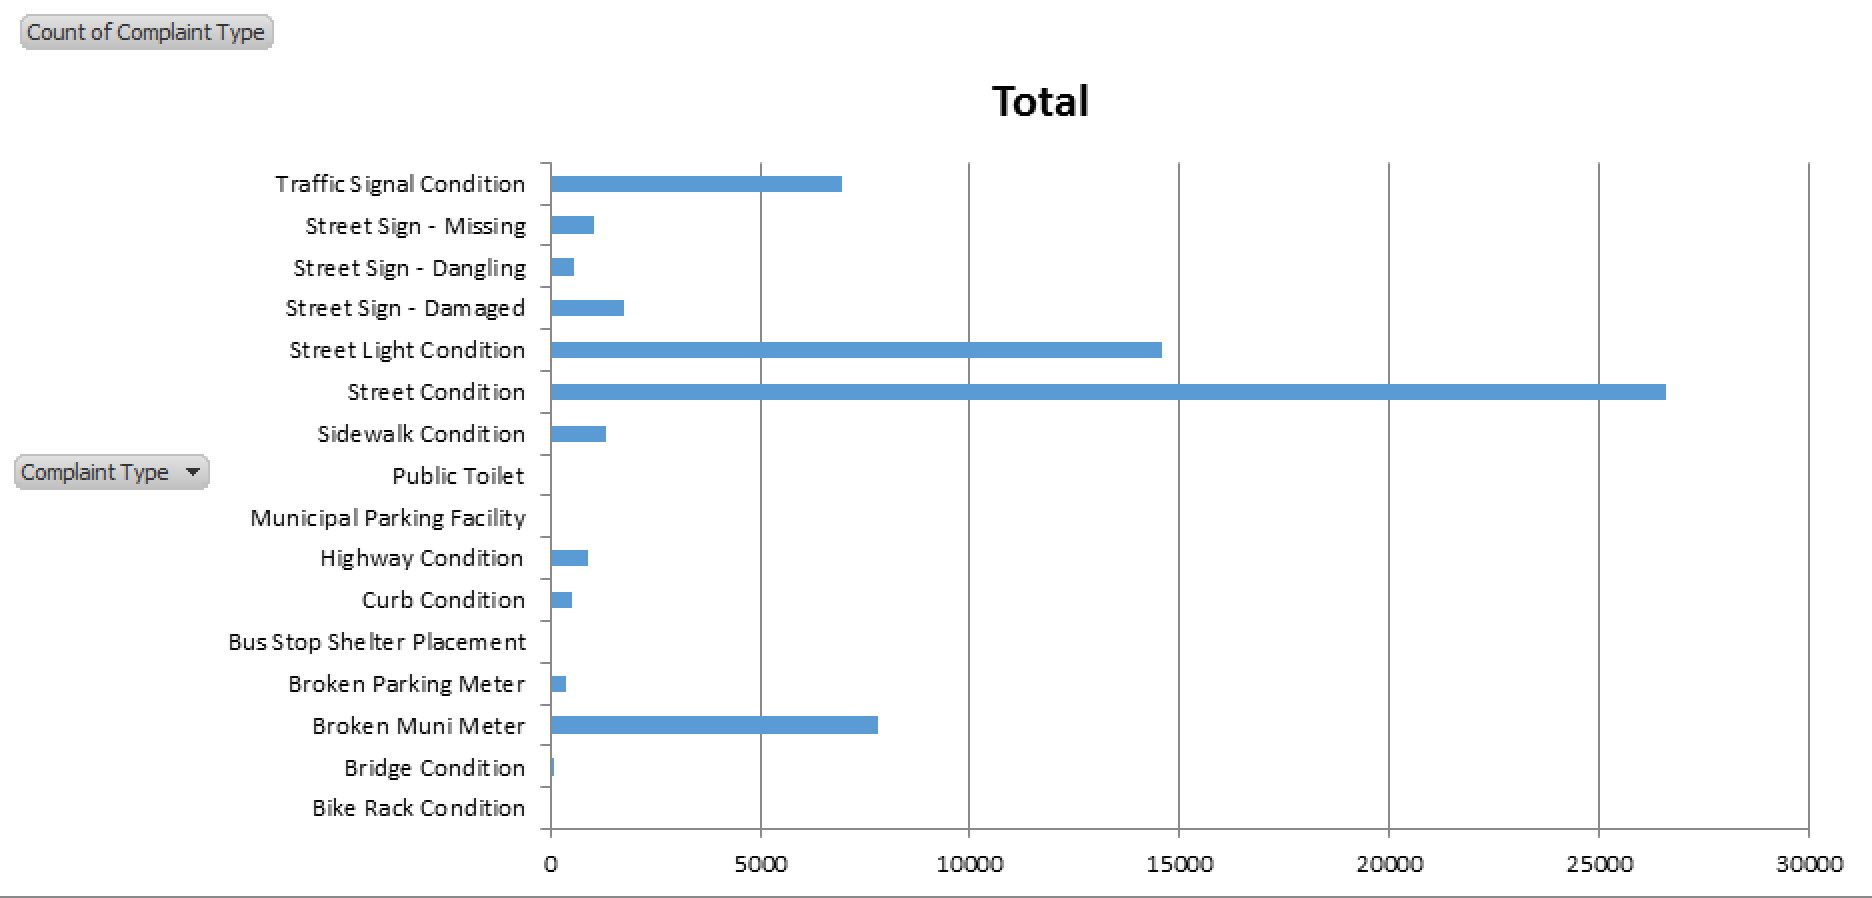 --- # Create a Ranked Horizontal Bar Chart 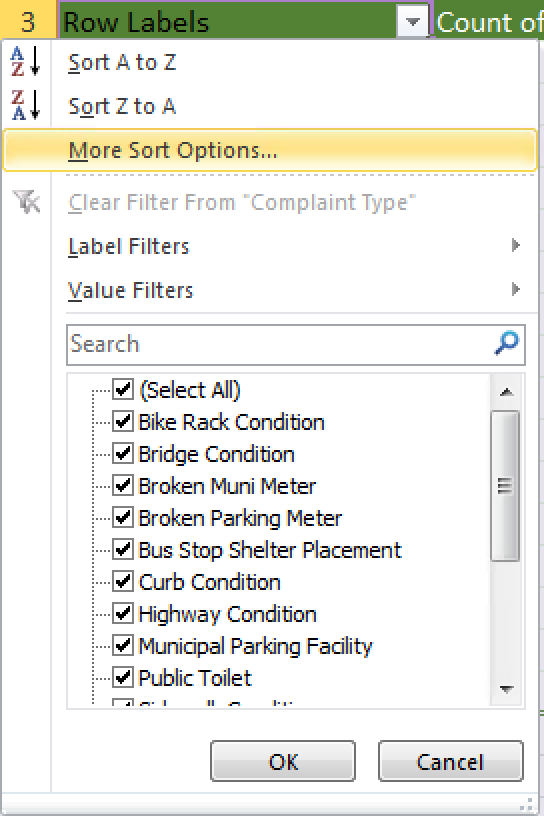 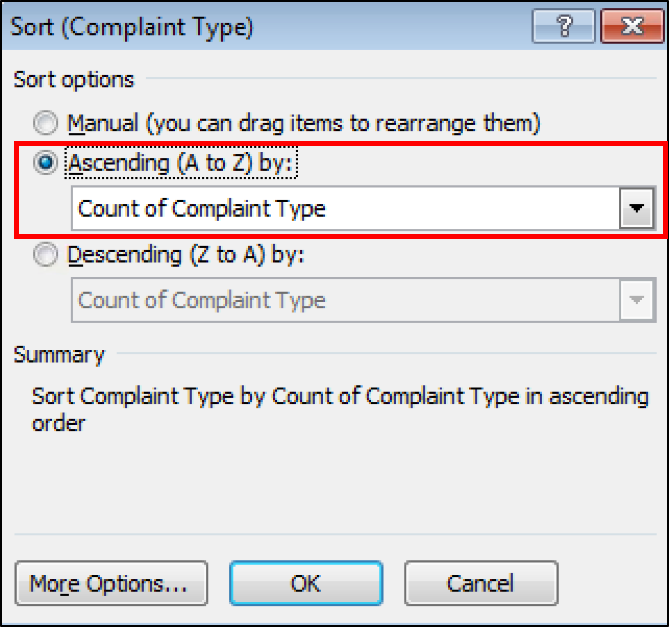 --- # Create a Ranked Horizontal Bar Chart 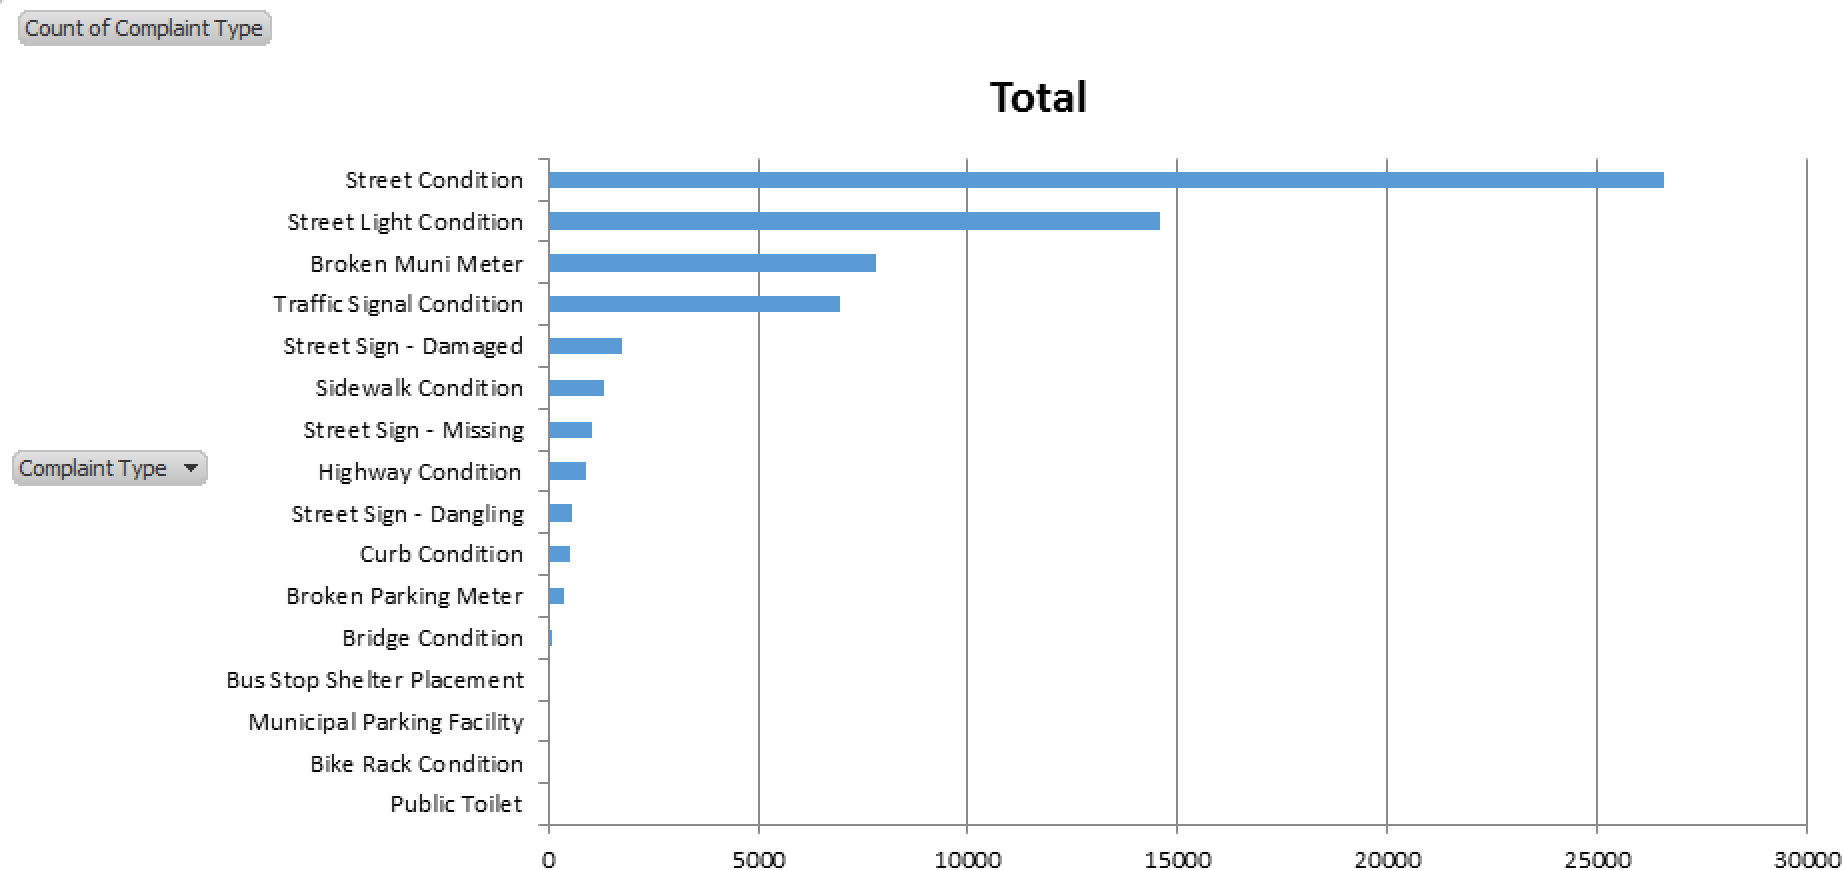 --- # Create a Grouped Column Chart 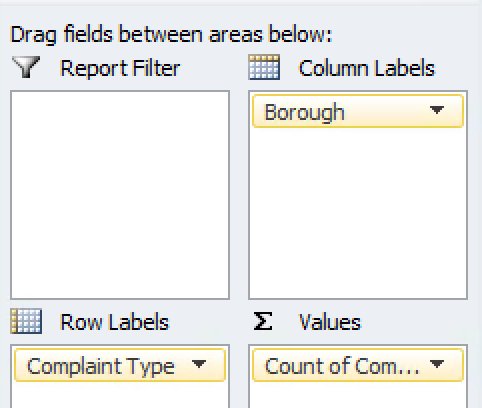 + Add `Borough` to `Column Labels` -- + Copy and paste the top 5 complaint types to a separate sheet -- + Highlight the data and create a column graph 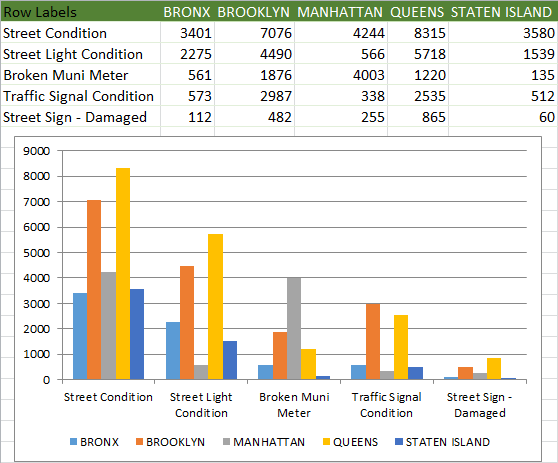 --- # Create a Stacked Column Chart 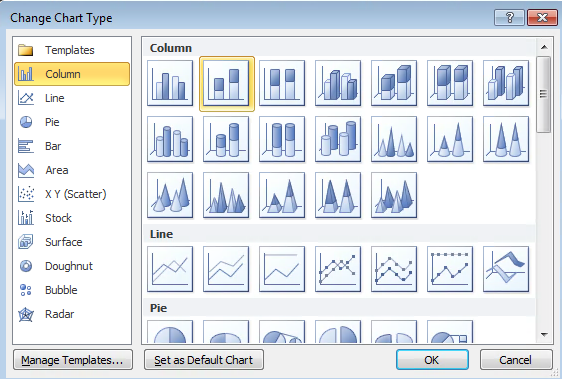  --- # Create a 100% Stacked Column Chart   --- # Create a Line Chart  + Create a PivotTable with `Month-Day` -- + Insert a line chart  --- # Create a Line Chart  --- # Create a "Barless" Bar Chart + Right click the series on the chart and select "Format Data Series"  --- # Create a "Barless" Bar Chart + Right click chart and select "Format Data Series" + Select "Line Color" and change to "No Line"  --- # Create a "Barless" Bar Chart  --- class:center,middle # How do you learn to create good visualizations? # --- class:center,middle # How do you learn to create good visualizations? # ...Make a lot of bad visualizations --- # Designing Your Charts ??? + Facilitator releases participants to explore the data on their own + Facilitator helps participants with any issues analyzing the data + Participants practice presentation skills and articulating their analysis to a group + Facilitators emphasize telling a story with data -- + Take some time to design your charts -- + Continue to work in pairs, groups, or on your own -- + Be prepared to share your visualizations with each other -- + We'll be around to help --- # Your Turn + Leave up on your monitor one chart you'd like feedback on -- + Within the next 10 minutes, visit at least 4 computers of people not in your group -- + Leave feedback for each chart on a Post-It stuck to the monitor (2 praises and a push) -- + Remember to honor the assumption of noble regard and positive intent (i.e. don't be a jerk) --- class:center,middle # Lunch --- class:center,middle # Welcome Back! --- #Review of the Morning -- + Discussed the why’s and how’s of creating visualizations -- + Introduced PivotCharts -- + Examined 2 of the 4 steps to creating effective data visualizations -- + Evaluated their application with real world examples -- + Applied our learning to our own visualizations -- + Gave and received feedback --- #This Afternoon -- + Incorporate feedback from our peers -- + Examine the last 2 steps for creating effective data visualizations -- + Apply the learning to our own visualizations -- + Anything else? --- # Four Steps to Creating an Effective Visualization + <span style="color:gray">Define your story</span> + <span style="color:gray">Choose your charts</span> + Refine your visuals + <span style="color:gray">Present your story</span> --- # Key Elements to Consider When Refining a Visual -- + Amount of data -- + Title -- + Color -- + Data-Ink Ratio --- class:center,middle # Let's see them in action --- class:center,middle # Amount of Data --- # Amount of Data -- + Remove data that doesn't support the story -- + Question: How has the population in NYC changed since 1970? --  --- class:center,middle # Title and Annotations --- # Title and Annotations ## Use the title and annotations to direct the reader's analysis -- + Describe the source of the data -- + Ask a question that the data answers -- + Tell the reader the conclusion of the visualization -- + Point out the trend or pattern you'd like the audience to notice -- + Keep it brief --- # Title and Annotations  ??? + Bringing back an old chart. --- # Title and Annotations  .caption[Image Credit: [Bloomberg Markets](https://www.bloomberg.com/markets), [CC BY-SA 2.0](https://creativecommons.org/licenses/by-sa/2.0/)] ??? + Thoughts on chart? Constructive criticism? --- # Title and Annotations 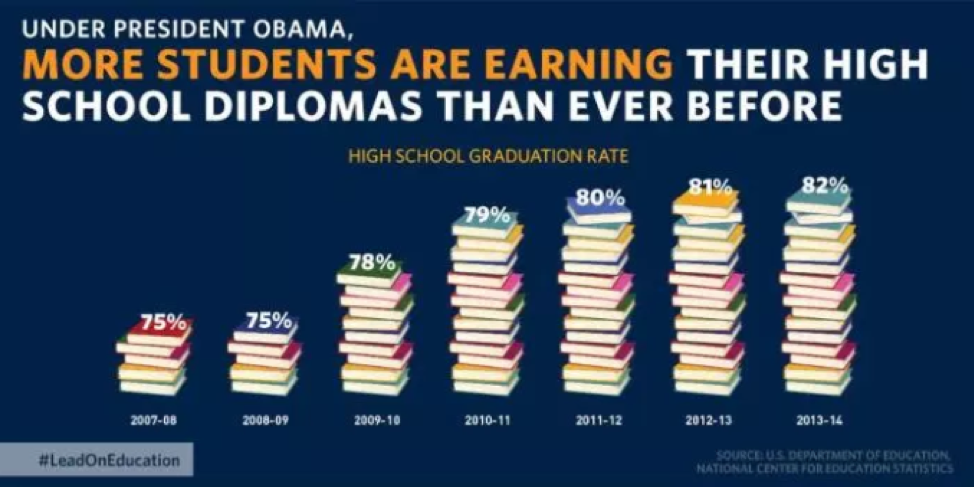 .caption[Image Credit: [US DOE](https://twitter.com/obamawhitehouse/status/677242822920151045), [CC BY-SA 2.0](https://creativecommons.org/licenses/by-sa/2.0/)] ??? + Thoughts on chart? Constructive criticism? --- class:center,middle # Color --- # Use of Color 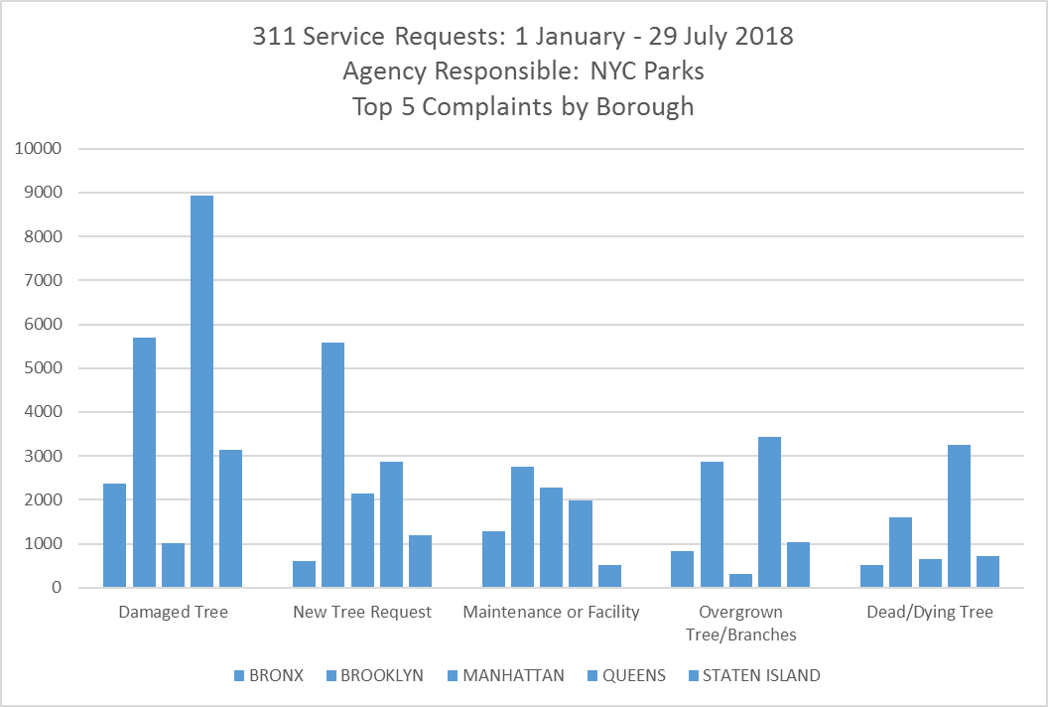 ??? + Demonstrates the impact of losing color, and how powerful color is as a discriminator in visualizations --- # Precognitive Processing 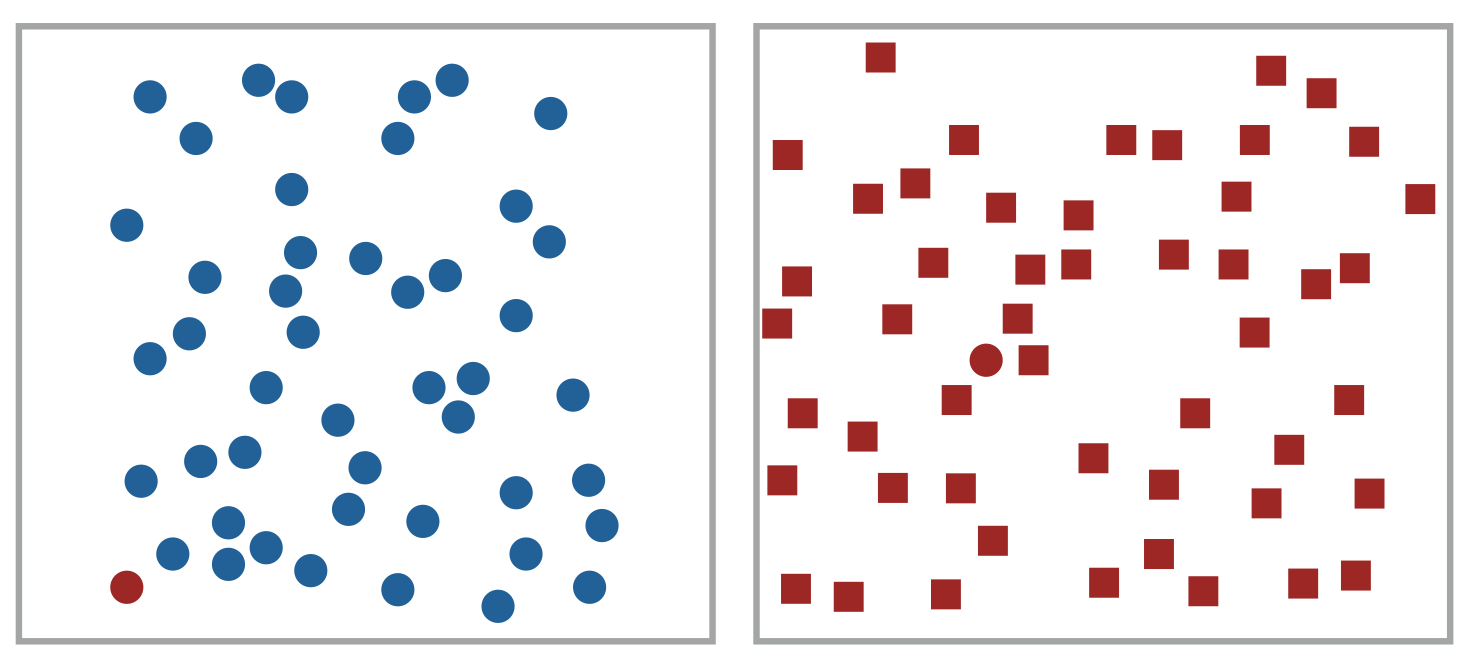 ??? + Facilitator prompts participants to find the red circle on the right and then on the left to demonstrate the ease of determining difference in color vs shape + Connect to idea of [precognitive (or "preattentive") visual processing](https://www.interaction-design.org/literature/article/preattentive-visual-properties-and-how-to-use-them-in-information-visualization) to make visualiations easier to understand --- # Use of Color 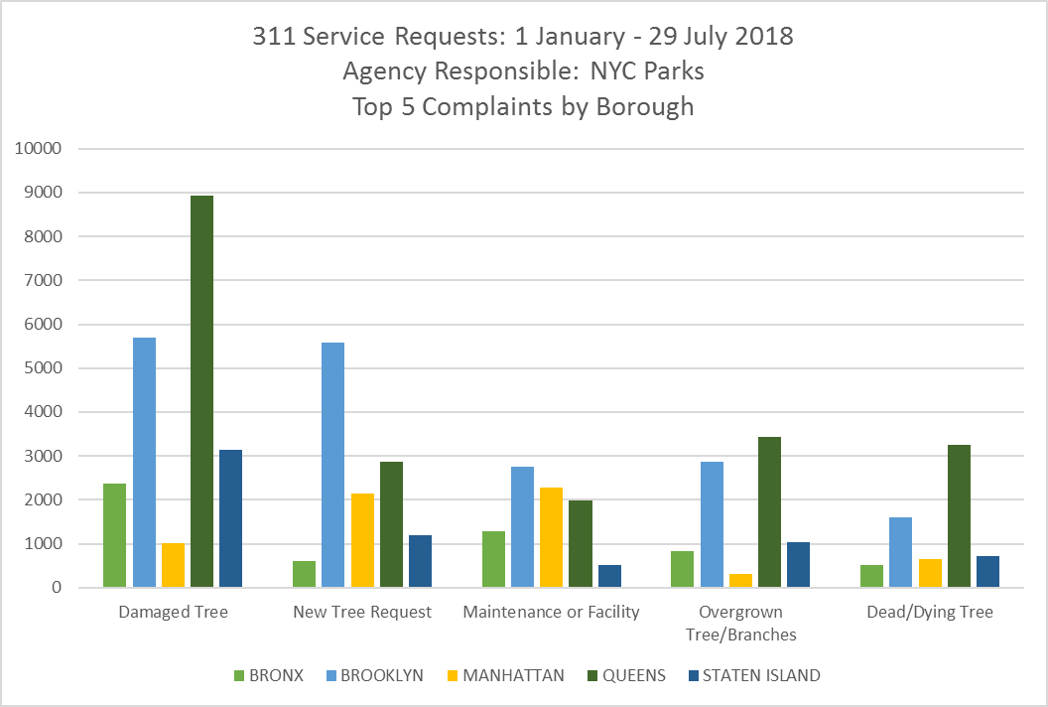 ??? + Allows categories to be compared together + Increases the information density (also saves space) --- # Use of Color -- ## Use color intentionally to make comprehension and interpretation easier. --- # Use of Color ## **For Sequential Numbers** -- + Use color scales with the darkest color representing the highest number and the lightest color representing the lowest number -- + Consider using two hues running light to dark for even more clarity --- # Use of Color ## **For Categorical Data** -- + Each category gets its own color --- # Use of Color ## **For Any Type of Data** -- + Consider grey to be the most important color. Use it to show the less important data while accentuating value(s) of interest in a color. --- # Use of Color  .caption[Image Credit: [Bloomberg](https://www.bloomberg.com/news/features/2018-07-26/she-launches-spaceships-sells-rockets-and-deals-with-elon-musk), [CC BY-SA 2.0](https://creativecommons.org/licenses/by-sa/2.0/)] --- # Use of Color  .caption[Image Credit: [Wall Street Journal](https://www.wsj.com/articles/SB10001424127887324439804578103470239517336), [CC BY-SA 2.0](https://creativecommons.org/licenses/by-sa/2.0/)] --- # Use of Color  ??? + Bringing back an old chart. --- # Tips for Using Color -- + Be sure there's a sufficient difference between your colors -- + Color scales are worth exploring -- + Watch out for the connotation of certain colors (ex: red) -- + Avoid patterns -- + Don't use more than 6 colors -- + Resource for color scales: [Color Brewer](http://colorbrewer2.org) --- # Color Tools - <a href="http://www.colorbrewer2.org/" target="_blank">ColorBrewer</a>  + Define the format in the menu --- # Color Tools - <a href="http://www.colorbrewer2.org/" target="_blank">ColorBrewer</a>  + Define the format in the menu + Select the number of classes --- # Color Tools - <a href="http://www.colorbrewer2.org/" target="_blank">ColorBrewer</a>  + Define the format in the menu + Select the number of classes + Select the nature of your data --- # Sequential - 3 classes  --- # Sequential - 5 classes  --- # Diverging - 5 classes  --- # Other Features -- + Options for colorblind safe and print friendly -- + Offers [hex](http://stackoverflow.com/questions/22239803/how-does-hexadecimal-color-work), [RGB](https://en.wikipedia.org/wiki/RGB_color_model), and [CYMK](https://en.wikipedia.org/wiki/CMYK_color_model) codes --    --    --  --- # You can use the RGB to define colors in Excel   --- class:middle >Clutter and confusion are failures of design, not attributes of information. ## -Edward Tufte ??? + Class's thoughts on this? What does it mean? Do you agree? --- # Data-Ink Ratio -- + Ink used to describe the data / ink used to describe everything else -- + Want the numerator as large and the denominator as small as possible -- + Tufte calls the "everything else" chartjunk --- # Common Types of Chartjunk -- + Dark gridlines -- + Overuse of bright, bold colors -- + Unnecessary use of all uppercase -- + Unnecessary legends -- + Background color --- # Data-Ink Ratio  ??? + Thoughts on how to declutter --- # Data-Ink Ratio  --- #Editing Color in Excel  --- #Editing Color in Excel  --- #Adding and Removing Elements  --- # Refining Your Charts ??? + Facilitator releases participants to explore the data on their own + Facilitator helps participants with any issues analyzing the data + Participants practice presentation skills and articulating their analysis to a group + Facilitators emphasize telling a story with data -- + Take some time to refine your charts -- + Incorporate the feedback you received from your peers -- + Apply strategy to your Titles, Annotations, and Color choices -- + Continue to work in pairs, groups, or on your own -- + We'll be around to help --- class:center,middle # 15 Minute Break --- class:center,middle # Sometimes we don't need a chart to visualize data --- # Conditional Formatting --  + Format cells based on value -- + Visually display values in cells -- + Great for quickly visualizing data and seeing trends --- # Conditional Formatting   --- # Conditional Formatting   --- # Create Sparklines + Create a pivot table of `complaint types` (row labels) and `month-day` (column labels)  --- # Create Sparklines + Select across the first data row (not the labels). Don't include the total column! -- 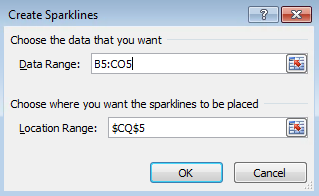 -- + Copy and paste the sparkline down --- # Create Sparklines 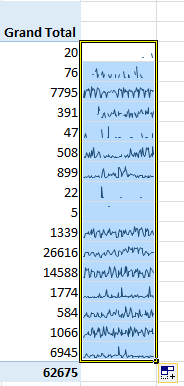 + By default, the min and max is relative to each row -- + Change that in the menu 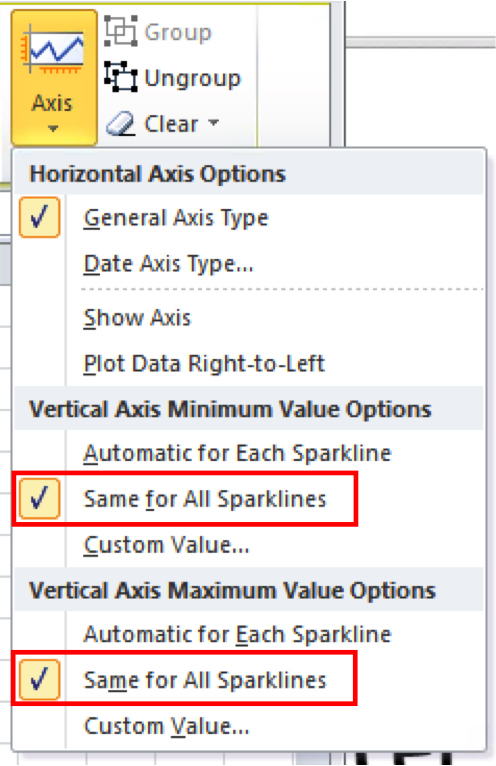 --- # Create Sparklines 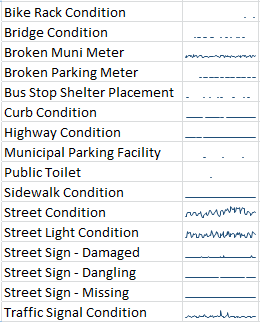 --- # Exporting Graphics -- + You can copy and paste graphics into any Microsoft application -- + The default is a Microsoft Office Graphic Object 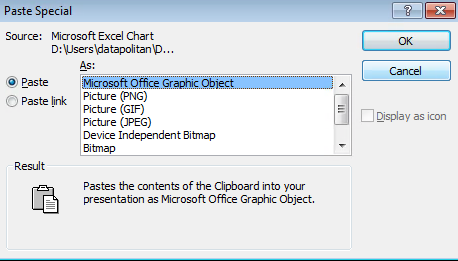 -- + You can change to an image or other format -- + [More information is online](http://www.thespreadsheetguru.com/blog/best-way-to-paste-special-excel-objects-as-powerpoint-images) --- # Your Turn -- + In pairs or in groups, export your visualizations to PowerPoint as images -- + Order your questions and visualizations into a presentation -- + [Click to submit your work](https://script.google.com/a/macros/datapolitan.com/s/AKfycbwMcE5pcJwZHdbSCN_2epwaXnRLSRPaLbHCAhxaZJ79UXaRpQ_l/exec) --- class:center,middle # Presentations --- class:center,middle # Wrap-Up --- # What we've covered -- + Anatomy of a chart -- + Types of charts -- + Creating charts in Excel -- + What else? --- class:center,middle # What's to Come ??? + Let participants know about full day class to come --- class:center,middle # Resources --- # Books --  # Edward Tufte, [The Visual Display of Quantitative Information](https://www.edwardtufte.com/tufte/books_vdqi) -- ####  # Tamara Munzner, [Visualization Analysis and Design](http://www.cs.ubc.ca/~tmm/vadbook/) --- # Books  #[Color Harmony Compendium](http://www.amazon.com/Color-Harmony-Compendium-Reference-Anniversary/dp/1592535909) -- #  # Isabel Meirelles, [Design for Information](http://www.amazon.com/gp/product/1592538061) --- # Blogs + [FlowingData.com](http://flowingdata.com/) + [Junk Charts](http://junkcharts.typepad.com/junk_charts/) + [Visualising Data](http://www.visualisingdata.com/) + [Enrico Bertini](http://enrico.bertini.io/) [FILWD (Fell In Love With Data)](http://fellinlovewithdata.com/) --- # Resources -- + [Microsoft Excel keyboard shortcuts](https://support.office.com/en-us/article/keyboard-shortcuts-in-excel-for-windows-1798d9d5-842a-42b8-9c99-9b7213f0040f) -- + [Microsoft Office Community](https://answers.microsoft.com/en-us/msoffice/forum/msoffice_excel?sort=LastReplyDate&dir=Desc&tab=All&status=all&mod=&modAge=&advFil=&postedAfter=&postedBefore=&threadType=All&isFilterExpanded=false&page=1) - Community Q&A Board -- + [7 essential Excel tricks every office worker needs to know](https://www.microsofttraining.net/sharing/11-seven-essential-excel-tricks-every-office-worker-needs-to-know.html) (we covered 6 of the 7 today) -- + [11 Places That Can Turn You Into A Microsoft Excel Power User](https://medium.com/the-mission/eleven-places-that-can-turn-you-into-a-microsoft-excel-power-user-c119f18e138c) <!-- + [Data Sensemaking](http://fellinlovewithdata.com/teaching/developing-a-data-sensemaking-course) by Enrico Bertini --> -- + [Copy of today's handout](workbook.pdf) -- + [Datapolitan Training Classes](http://training.datapolitan.com) --- # Final Thoughts -- + Don't always (or ever) accept the defaults -- + Don't be afraid to experiment -- + Reduce clutter (especially chart junk) whenever possible -- + Pay attention to your data-ink ratio -- + Visualization is a team sport --- name:contact # .center[Contact Information] ## Elizabeth DiLuzio + Email: Elizabeth[at]datapolitan[dot]com + Website: [www.evallearn.com](www.evallearn.com) + Twitter: [@lizdiluzio](https://twitter.com/lizdiluzio) ## Mark Yarish + Email: mark.yarish[at]gmail[dot]com + Twitter: [@markyarish](https://twitter.com/markyarish) --- class:center, middle # THANK YOU! --- <!-- class:middle  Source: http://visual.ly/renewable-energy-production-state --- # Data Visualization  --- # What Elements Make Up a Good Chart? --  + Title --- # What Elements Make Up a Good Chart?  + Title + Axis Labels --- # What Elements Make Up a Good Chart?  + Title + Axis Labels + Legend --- # What Elements Make Up a Good Chart?  + Title + Axis Labels + Legend + Annotations (if necessary) -- ## ## <a href="//en.wikipedia.org/wiki/User:Farcaster" class="extiw" title="wikipedia:User:Farcaster">Farcaster</a> at <a href="//en.wikipedia.org/wiki/" class="extiw" title="wikipedia:">English Wikipedia</a> [<a href="http://creativecommons.org/licenses/by-sa/3.0">CC BY-SA 3.0</a>, <a href="http://www.gnu.org/copyleft/fdl.html">GFDL</a>, <a href="http://creativecommons.org/licenses/by-sa/3.0">CC BY-SA 3.0</a> or <a href="http://www.gnu.org/copyleft/fdl.html">GFDL</a>], <a href="https://commons.wikimedia.org/wiki/File%3AExisting_Home_Sales_Chart_-_Mar_09b.png">from Wikimedia Commons</a> --- # Chart Content -- + Every visualization is a mapping between _**data objects and features**_ to _**visual objects and features**_ -- + We call this process "encoding" --- # Choosing Your Chart --  .caption[Image Credit: [Extreme Presentations](http://extremepresentation.com/wp-content/uploads/6a00d8341bfd2e53ef0148c699cc96970c.jpg), [CC BY-SA 2.0](https://creativecommons.org/licenses/by-sa/2.0/)] --- class:center,middle # Let's take a look at some of the more popular types --- # Type of Chart by Data Type ??? + In this series of photos, talk the students through the way we chart numeric vs categorical data + Point out why bar and pie charts are the most commonly seen (you can use them with any type of data) + To progress on to the next slide, ask: what are the two types of data? --  --- # Type of Chart by Data Type  ## Data is always one of two types: numerical and categorical --- # Type of Chart by Data Type  --- # Type of Chart by Data Type  --- # Type of Chart by Data Type  ## Bar and pie charts can be used to visualize both quantitative and qualitative data --- # Bar Chart  ??? + Facilitator prompts with question "What are we visualizing here?" --- # Horizontal Bar Chart  ??? + Key feature of this chart is labels that are easier to read across and longer range so smaller quantities can be compared + Odd for data to be displayed this way vs. vertical bars --- # Ranked Horizontal Bar Chart  ??? + Sorting the data allows for data points to be rank-ordered and easier to understand --- # Grouped Bar Chart  ??? + Demonstrates the impact of losing color, and how powerful color is as a discriminator in visualizations --- # Stacked Bar Chart  ??? + Facilitator introduces stacked bar chart, discussing pros (able to compare) with cons (hard to interpret without labels) + Solicit feedback from students on what they think of the chart type --- # 100% Stacked Bar Chart  ??? + Facilitator introduces 100% stacked bar chart, discussing pros (able to compare proportions) with cons (hard to interpret without labels) + Solicit feedback from students on what they think of the chart type --- # Pie Charts  "Badpie" by Gilgongo - Own work. Licensed under [CC BY-SA 3.0](https://creativecommons.org/licenses/by-sa/3.0/us/legalcode) via [Wikimedia Commons](http://commons.wikimedia.org/wiki/File:Badpie.png#/media/File:Badpie.png) ??? + Facilitator presents an alternative scenario of many small slices as a potential issue + Good to note tendency to add labels to the point of making it a table with color and point out the color reuse in the chart, making it hard to interpret --- # Type of Chart by Data Type  ## Line charts and dot plots are best for numeric data --- # Line Chart  ??? + Facilitator discusses when to use a line chart (time-series data connected to each other) + Possible to point out the visualization encodes not only the level but the relationship of one to the next (slope of the line) + Can point out this is like the heart-beat of the city, or at least of NYC Parks --- # "Barless" Bar Chart  ??? + Facilitator prompts with question "What are we visualizing here?" + Important to let them realize this is the same data and then ask if it is better or worse than previous, and why + Good to point out the lack of line between the point and the label, hard to compare across categories --- # Line Chart with Categorical Data  ??? + This is an example of what not to do with the data. Each category is distinct and not related, though the chart implies it is. Participants will likely have done this before, but should be asked to reflect on whether one category has an impact on another. + Good opportunity to reflect on the fact Excel doesn't care about the kind of chart you create and will produce whatever you tell it to --- # Type of Chart by Data Type  ## Tree maps are best for categorical data --- name:treemap # [Treemap](https://en.wikipedia.org/wiki/Treemapping)  ??? + An alternative visualization that is more advanced, but interesting for it's possibilities (still probably need numbers) --- -->