layout:true <div class="header" style="display:block; text-align: left; color:gray; font-size:1em; position: fixed; top: 0px; left: 0px; height: 30px;vertical-align:middle;margin:7px 0 0 0;width:100%;background: #fcfcfc; background: -moz-linear-gradient(top, #fcfcfc 0%, #d1d1d1 100%); background: -webkit-linear-gradient(top, #fcfcfc 0%,#d1d1d1 100%); background: linear-gradient(to bottom, #fcfcfc 0%,#d1d1d1 100%); filter: progid:DXImageTransform.Microsoft.gradient( startColorstr='#fcfcfc', endColorstr='#d1d1d1',GradientType=0 );"> <img src="images/datapolitan_trans_small.png" style="position: fixed;top: 2px; left: 5px; width: 15%;"> <p style="display:block;text-align:left;color:gray;font-size:1em; position: fixed; top: 0px; left: 155px; height: 30px;vertical-align:middle;margin:7px 0 0 0; ">Analytics for the Data-Driven Manager</p> </div> <div class="footer" style="display:block;color:gray;position:fixed;bottom: 0px;left:0px;height:30px;vertical-align:middle;margin:0 0 0 0;width:100%;background: #fcfcfc;background: -moz-linear-gradient(top, #fcfcfc 0%, #d1d1d1 100%);background: -webkit-linear-gradient(top, #fcfcfc 0%,#d1d1d1 100%);background: linear-gradient(to bottom, #fcfcfc 0%,#d1d1d1 100%);sfilter: progid:DXImageTransform.Microsoft.gradient( startColorstr='#fcfcfc', endColorstr='#d1d1d1',GradientType=0 );"> <p class="footer"> <span xmlns:dct="http://purl.org/dc/terms/" property="dct:title">Analytics for the Data-Driven Manager</span> by <a xmlns:cc="http://creativecommons.org/ns#" href="http://www.datapolitan.com" property="cc:attributionName" rel="cc:attributionURL">Richard Dunks</a> and <a xmlns:cc="http://creativecommons.org/ns#" href="https://www.tinypanther.com/" property="cc:attributionName" rel="cc:attributionURL">Julia Marden</a> is licensed under a <a rel="license" href="http://creativecommons.org/licenses/by-sa/4.0/">Creative Commons Attribution-ShareAlike 4.0 International License</a>.<a rel="license" href="http://creativecommons.org/licenses/by-sa/4.0/"><img alt="Creative-Commons-License" style="border-width:0" src="https://i.creativecommons.org/l/by-sa/4.0/80x15.png" /></a> </p> </div> -- class:center, middle  # Analytics for the Data-Driven Manager - - - ## Instructors: Elizabeth DiLuzio and Elana Shneyer ### Follow along at: http://bit.ly/data-driven-manager #### See the code at: http://bit.ly/data-driven-manager-code --- name:day1 class:center,middle # Welcome ## [Skip to Day 2](#day2) ??? + Facilitators introduce themselves + Facilitators (respectfully) assert authority to be teaching material + Facilitators begin creating a safe, comfortable container for participants --- # A Few Ground Rules -- + Step up, step back -- + Be curious and ask questions! -- + Assume noble regard and positive intent -- + Respect multiple perspectives -- + Listen deeply -- + Be present (phone, email, social media, etc.) --- # Data Driven Culture  ??? + Facilitators briefly introduce the idea that data analysis is a team sport + Facilitators connect this idea to the collaborative introduction exercise that follows --- # Introduce Yourself to Your Neighbor + Who are you? + Where do you work? + What has been the proudest moment in your job? ??? + Participants engage in a collaborative introduction exercise to engage their fellow participants and begin the day talking + Participants relax into the container created by the facilitators --- # What to Expect Today + 9:50 – Data Analytics 101 + 10:15 - Introduction to Problem Ideation + 10:45 – 15 Min Break + 11:00 – Process Mapping and the Types of Analysis + 12:30 – Lunch + 1:00 – MODA Overview + 1:30 – Group Brainstorming/Process Map + 2:30 – 15 Min Break + 2:45 – Project Development/Presentations + 4:00 – Dismissal ??? + Outline of activities for participants awareness --- name:housekeeping # Housekeeping -- + We’ll have one 15 minute break in the morning -- + We’ll have a half-hour for lunch -- + We’ll have a 15 minute break in the afternoon -- + Class will start promptly after breaks -- + Feel free to use the bathroom if you need during class -- + Please take any phone conversations into the hall to not disrupt the class --- # The Value of Data -- + Data tells a story about something that's happened -- + Can describe what happened directly or indirectly --  -- ### .caption[[Sensing Noise in NYC](https://www.nytimes.com/2016/11/07/nyregion/to-create-a-quieter-city-theyre-recording-the-sounds-of-new-york.html?_r=0)] ??? + Facilitators prompt students with the question "Why is data useful?" and/or "Why do we use it?" + Facilitators contrast this with the question "How would we make decisions without data?" to tease out the need for data to check assumptions and limited problem awareness + Facilitators carefully acknowledge that intuition, experience, and anecdotes can be useful but shouldn't be the sole source of knowledge and information --- class: center,middle # Are All Data Points Created Equal? ??? + Facilitators lead a brief discussion of the issues with data + Issues to be touched on include: data entry errors, biases in data, data cleaning errors, etc. --- class:middle > Facts do not "speak for themselves." They speak for or against competing theories. Facts divorced from theory or visions are mere isolated curiosities. ##-Thomas Sowell *A Conflict of Visions* ??? + Facilitators develop the theme of data skepticism by talking about the importance of context to understanding numbers provided in analysis + An example I often use is "What if I told you there's a 2% drop in crime? What do we need to know to make that number useful?" + Facilitator emphasizes that the goal of analysis is telling a true and compelling story, and communicating context whenever possible --- # Data Driven Decisions Require Humans --  .caption[Image Credit: 100 lion, [CC BY-SA 4.0](http://creativecommons.org/licenses/by-sa/4.0), via [Wikimedia Commons](https://commons.wikimedia.org/wiki/File%3AIphone-62.jpg)] ## [How Intel lost out on the contract of a lifetime](http://appleinsider.com/articles/13/05/16/intel-chips-could-have-powered-first-iphone-ceo-otelini-says) ??? + Facilitators introduce story of data-driven gone awry to develop a healthy skepticism about data-driven --- exclude:true # Being data-driven doesn't mean blindly following data  .caption[Image Credit: zhouxuan12345678, [CC BY-SA 2.0](https://creativecommons.org/licenses/by/2.0/), via [Flickr](https://www.flickr.com/photos/53921113@NO2/5453212152)] ??? + Facilitator elaborates on the theme of data skepticism with the example of a GPS leading a driver into a pond or almost off a cliff to emphasize the need to keep awareness of context --- > Data is only as valuable as the decisions it enables. ### - [Ion Stoica](https://twitter.com/databricks/status/810190036624875520) -- > If data is enabling important decisions, then the data is important too ### - [Richard Dunks](https://twitter.com/Datapolitan/status/921435585386033153) ??? + Facilitators emphasize data as a strategic resource for managers --- # What is Analysis? -- > “Analysis is simply the pursuit of understanding, usually through detailed inspection or comparison” ## - [Carter Hewgley](https://www.linkedin.com/in/carterhewgley), Senior Advisor for Family & Homeless Services, Department of Human Services, District of Columbia --- exclude: true class:center, middle # Data Analysis Should Drive Decision Making # This is what it means to be "data driven" ## And good analysis should lead to good decisions --- class:center,middle # What Analysis Isn't --- # Writing a report  .caption[Image Credit: RRZEicons, [CC BY-SA 3.0](http://creativecommons.org/licenses/by-sa/3.0), via [Wikimedia Commons](https://commons.wikimedia.org/wiki/File:Report.svg)] --- # Creating a dashboard  .caption[Image Credit: Chabe01, [CC BY-SA 4.0](http://creativecommons.org/licenses/by-sa/4.0), via [Wikimedia Commons](https://commons.wikimedia.org/wiki/File%3ADashboard_OS_X.svg)] --- # Generating an alert  .caption[Image Credit: Tokyoship, [CC BY-SA 3.0](http://creativecommons.org/licenses/by-sa/3.0), via [Wikimedia Commons](https://commons.wikimedia.org/wiki/File%3ASimple_Alert.svg)] --- name:avp # It's Putting Them All Together  --- > We move from data to information to knowledge to wisdom. And... knowing the limitations & the danger of exercising one without the others, while respecting each category of intelligence, is generally what serious education is about. ## - Toni Morrison, "[The Source of Wisdom and Self-Regard](https://www.amazon.com/Source-Self-Regard-Selected-Speeches-Meditations/dp/0525521038)" ??? + This is the epitome of the value of data. Used well, it moves us to wisdom. --- class: middle > "If you do not know how to ask the right question, you discover nothing." ## - W. Edward Deming --- # Our Method For Generating Ideas --  + **Ideate** - On your own, generate at least 3 ideas (ideally more), each on their own Post-It Note ####  --- # Our Method For Generating Ideas  + **Ideate** - On your own, generate at least 3 ideas (ideally more), each on their own Post-It Note + **Discuss** - Review the ideas generated --- # Our Method For Generating Ideas  + **Ideate** - On your own, generate at least 3 ideas (ideally more), each on their own Post-It Note + **Discuss** - Review the ideas generated + **Decide** - Come to a consensus as a group --- # Exercise - Reducing Noise Complaints in NYC + Between 1 Jan and 31 Mar 2018, there were an average of 943 noise-related 311 service requests a day -- + The same period in 2019 had an average of 992 noise-related 311 service requests a day -- + You've been tasked with decreasing noise complaints in the city -- + .red[What questions would you ask to kick off a data analysis?] -- + We will ideate using a [timed](https://www.google.com/search?q=timer&rlz=1C1GCEU_enUS852US852&oq=timer&aqs=chrome..69i57j0l5.519j0j7&sourceid=chrome&ie=UTF-8) 5-5-5 structure ??? + A facilitated group ideation exercise to get them thinking about key questions and problems + Task to participants: (1) take 5 minutes to come up with your own questions and be prepared to share with the group (2) take 5 minutes and discuss with your partner (3) discuss the questions as a group + Facilitator helps scope an analytical question that will be developed throughout the morning lecture session + Group should have written down a series of questions to be discussed --- class:center,middle # What do you think? ??? + Facilitator debriefs with class about what they think about the process and its benefits --- class:center,middle # 15 MIN BREAK  [Source](https://xkcd.com/1739/) --- # Process Mapping -- + Allows you to identify and strategize for key steps in your analysis -- + Helps sequence tasks and identify gaps in understanding -- + Provides a basis for documenting work --- # Process Mapping  .caption[By Scottsm1991 (Own work) [CC BY-SA 3.0](http://creativecommons.org/licenses/by-sa/3.0), via Wikimedia Commons] ??? + Facilitator does the "I do" phase by describing a past project that was mapped out --- exclude:true # Process Map  .caption[Analyzing pet licensing compliance in San Jose. Image Credit: Datapolitan [CC BY-SA 4.0](http://creativecommons.org/licenses/by-sa/4.0/)] --- # How to Create a Process Map --  + Identify the key challenge -- + Identify the outcome -- + Identify key way to validate the outcome (outputs)<br> -- _**How do we know we've got it right?**_ --- # Outcomes vs Outputs -- + Outcomes are the larger benefits and/or achievements you're trying to realize<br> -- (happiness, health, well-being, etc.) -- + Outputs are the tangible parts of your outcome<br> -- (survey responses, measured results, etc.) -- + Outputs enable us to find outcomes -- + Without outcomes, there is no need for outputs --- # How to Create a Process Map  + Identify the key challenge + Identify the outcome + Identify key way to validate the outcome (outputs)<br>_**How do we know we've got it right?**_ -- + Identify the key inputs (data, partners, etc.) -- + Sequence the key questions to turn inputs into outputs --- --- # Key Tips  + Place each step on a Post-It Note ####  --- # Key Tips  + Place each step on a Post-It Note + Order and reorder as necessary -- + Some steps will need to be broken down ??? + Facilitator identifies the key parts of the process based on the graphic presented + Faciliator reminds participants to follow the process that works best for them --- # Reducing Noise Complaints  ??? + The more involved "We do" phase where we do this together -- + Identify the key outcome -- + Identify the outputs -- + Identify the key inputs -- + Identify key steps to use the inputs to achieve the outcome ####  .caption[[Image](https://www.flickr.com/photos/jackdorsey/272873611/) by [Flickr user Jack Dorsey](https://www.flickr.com/photos/jackdorsey/) [CC BY 2.0](https://creativecommons.org/licenses/by/2.0/)] --- # What did you notice about this process? ??? + Facilitator reflects with participants on the process mapping exercise -- + Knowing the problem and sequencing the steps can be harder than working with data -- + Having these answers can make the analysis much easier -- + This is a process you can do with any challenge, no matter how big -- + Everyone has something to add, no matter how technical (or non-technical) they are --- name:nola class:center,middle # Types of Analysis [](https://datadriven.nola.gov/home/) [](https://datadriven.nola.gov/home/) Based on the work of the [City of New Orleans, Office of Performance and Accountability](https://datadriven.nola.gov/home/) Graphics: Copyright © [Harvard University Ash Center](https://ash.harvard.edu/)(Used with Permission) ??? + Facilitator goes through the types of analysis with participants to introduce key ideas + Facilitator connects each type to either the process map they've created or to the their own work, with examples as a back-up if necessary --- class:center,middle  --- # Finding a Needle in Haystack  -- + Challenge: Targets are difficult to identify or locate within a broader population -- + Opportunity: Data analysis and predictive modeling to identify targets based on existing data --- # New Orleans Distributes Smoke Alarms  .caption[Image Credit: Michael Barnett [CC BY-SA 2.5](http://creativecommons.org/licenses/by-sa/2.5), via Wikimedia Commons] --- # Targeted Outreach Saves Lives  .caption[Image Credit: City of New Orleans, via [nola.gov](http://nola.gov/performance-and-accountability/nolalytics/files/full-report-on-analytics-informed-smoke-alarm-outr/)] --- # Targeted Outreach Saves Lives  .caption[Image Credit: City of New Orleans, via [nola.gov](http://nola.gov/performance-and-accountability/nolalytics/files/full-report-on-analytics-informed-smoke-alarm-outr/)] --- # Prioritizing Work for Impact  -- + Challenge: Services do not categorize high-priority cases early -- + Opportunity: Data analysis and predictive modeling to prioritize cases --- # NYC Restaurant Inspectors Save Time  .caption[Image Credit: Grease Trap Cover Asphalt by [Christopher Sessums](https://www.flickr.com/photos/csessums/4740455231), [CC BY 2.0](https://creativecommons.org/licenses/by/2.0/)] .center[Source: http://www.nyc.gov/html/bic/downloads/pdf/pr/nyc_bic_dep_mayoroff_policy_10_18_12.pdf] --- # Early Warning Tools  -- + Challenge: Resources overly focused on reactive services -- + Opportunity: Developing tools to predict need based on historic patterns --- # Using Data to Fight Fires  .caption[Image Credit: [NYC Mayor's Office of Data Analytics](http://www1.nyc.gov/site/analytics/index.page), [2013 Annual Report](https://assets.documentcloud.org/documents/1173791/moda-annual-report-2013.pdf)] --- # Better, Quicker Decisions  -- + Challenge: Repeated decisions are made without access to all relevant information -- + Opportunity: Developing recommendation tools for operational decisions --- # Cincinnati Targets Urban Blight  .caption[Image Credit: Wholtone, via [Wikimedia Commons](https://commons.wikimedia.org/wiki/File:Abandoned-Over-the-Rhine-building.jpg)] [Learn more](https://dssg.uchicago.edu/2015/08/20/blight-prevention-building-strong-and-healthy-neighborhoods-in-cincinnati/) --- # Optimizing Resource Allocation  -- + Challenge: Assets are scheduled or deployed without input of latest service data -- + Opportunity: Use data to drive decisions on the deployment of resources --- # Shortening Public School Bus Rides  Image Credit: [Patrick Hudepohl](https://www.flickr.com/photos/patrick-hudepohl/), used under [Creative Commons BY-NC-SA 2.0 license](https://creativecommons.org/licenses/by-nc-sa/2.0/). [Source](http://www.datakind.org/blog/datakind-and-sas-to-help-boston-public-schools-shorten-school-bus-rides-lower-costs) --- # Experimenting for What Works  -- + Challenge: Services have not been assessed for impact -- + Opportunity: Experimental testing and improvement of service options --- # Redesign of NYC Summonses 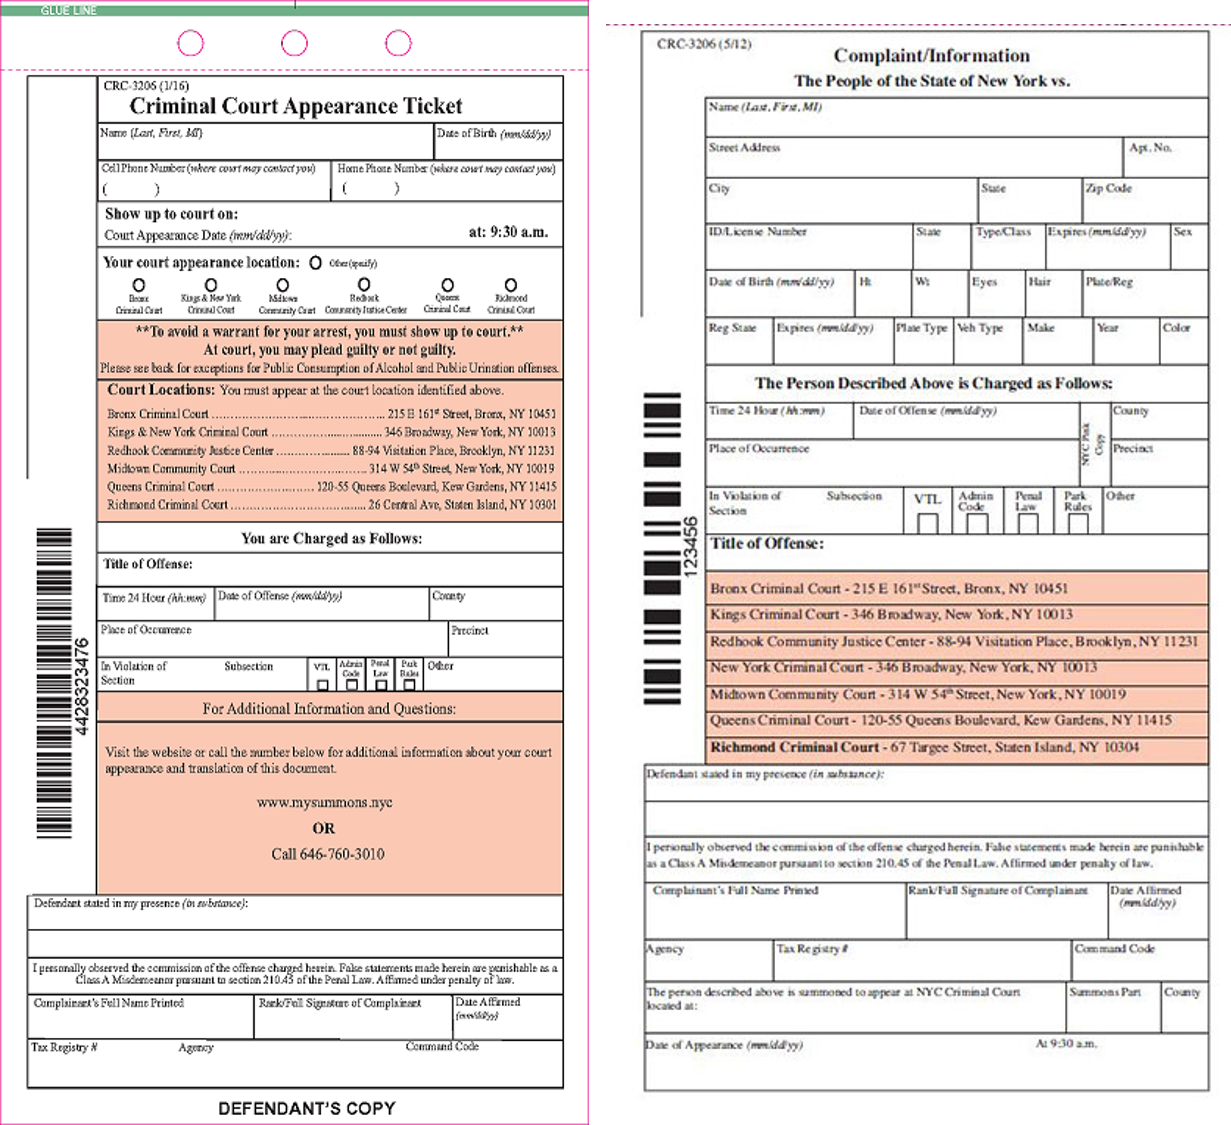 Image credit [City of New York](https://www1.nyc.gov/site/criminaljustice/work/summons_reform.page). [Click for more information](http://www.ideas42.org/blog/new-behaviorally-informed-nyc-summonses-hit-streets/) --- exclude:true # Value of Good Operational Analysis  .caption[Image Credit: Money by Andrew Magill, [CC BY 2.0](https://creativecommons.org/licenses/by/2.0/), via Flickr] ## City of Cincinnati saved $130,000 in late fees to utility company [Learn more](http://www.charlotteobserver.com/news/business/article32617293.html) --- exclude:true # Tracking Hurricane Sandy Relief Funds 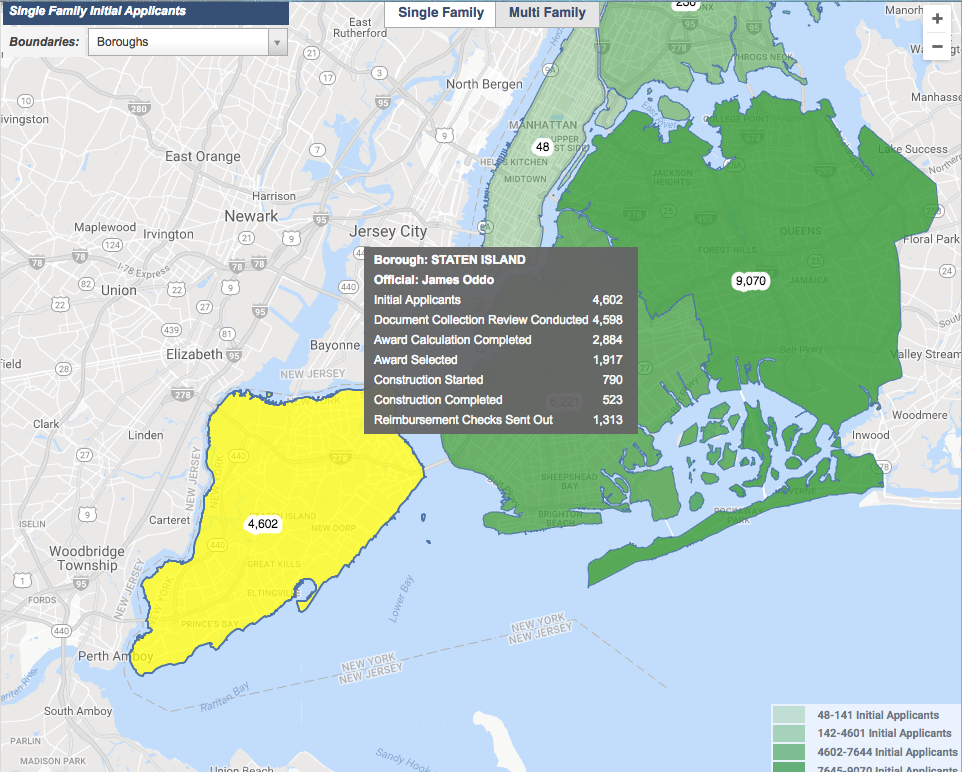 .caption[Image Credit: The City of New York, via [NYC.Gov](http://www1.nyc.gov/sandytracker/#2891665754)] --- # A Word on Performance Metrics -- + If it doesn't change your behavior, it's a bad metric  .caption[Image Credit: Jurgen Appelo, [CC BY 2.0](https://creativecommons.org/licenses/by/2.0/), via [Flickr](https://www.flickr.com/photos/jurgenappelo/8485492756)] --- # Performance Metrics + What metrics do we have in our process map? + Will they influence what we do? + Do we need more/better ones? --- # Goodhart's Law -- >“When a measure becomes a target, it ceases to be a good measure.” ## - Charles Goodhart, Economist -- # .orange[**How might this relate to our map?**] --- exclude:true class:center,middle # Discussion: What kind of analysis does your office do? --- class:center,middle # WRAP-UP --- class:center,middle # LUNCH  [Source](https://xkcd.com/210/) --- class:center, middle # WELCOME BACK! --- name:moda class:center,middle <a href="https://docs.google.com/presentation/d/1jqyEuWmDatL73mCfPlX_flfTyRgAbiLR1SmAvD5sMrU/edit#slide=id.g289c4a660b_0_123" target="_blank"></a> ## <a href="https://docs.google.com/presentation/d/1jqyEuWmDatL73mCfPlX_flfTyRgAbiLR1SmAvD5sMrU/edit#slide=id.g289c4a660b_0_123" target="_blank">Click for MODA Presentation Slides</a> --- class:center,middle # 4 Concerns --- # 1. Technical -- + Having the right tools -- + Having the people who can use them -- + Making everything work together -- + _Potential trap: having a solution in search of a problem_ --- # 2. Legal -- + Laws -- + Regulations -- + Practices and Precendents -- + _Potential trap: not doing something because of mistaken assumptions_ --- # When HIPAA Gets In The Way of Health Care  .caption[Image Credit: HIPAA Nurse Shredding Papers, by [Atlantic Training](http://www.atlantictraining.com/blog/hipaa-compliance-paper-shredding-illustration2/), [CC BY-SA 3.0](https://creativecommons.org/licenses/by-sa/3.0/deed.en_US)] [Learn more](http://www.nytimes.com/2015/07/21/health/hipaas-use-as-code-of-silence-often-misinterprets-the-law.html?_r=1) --- # 3. Cultural -- + “We’ve always done it this way” -- + “I’m not sure I understand how this works” -- + _Potential trap: being afraid of rocking the boat_ --- # 4. Political -- + Inter-departmental -- + Intra-departmental -- + Public relations -- + _Potential trap: not putting the necessary effort into something that will pay dividends to your office and ultimately to the organization as a whole_ --- # Concerns -- + Are there any concerns with what we've mapped out? -- + Do you have an example of these concerns in your work? --- # Benefits -- + Time, money, lives saved -- + Better delivery of services to stakeholders -- + More transparency -- + More accountability -- # .orange[**What could be some of the benefits we'd realize from what we've mapped?**] --- exclude: true # MTA Improves Purchase Options 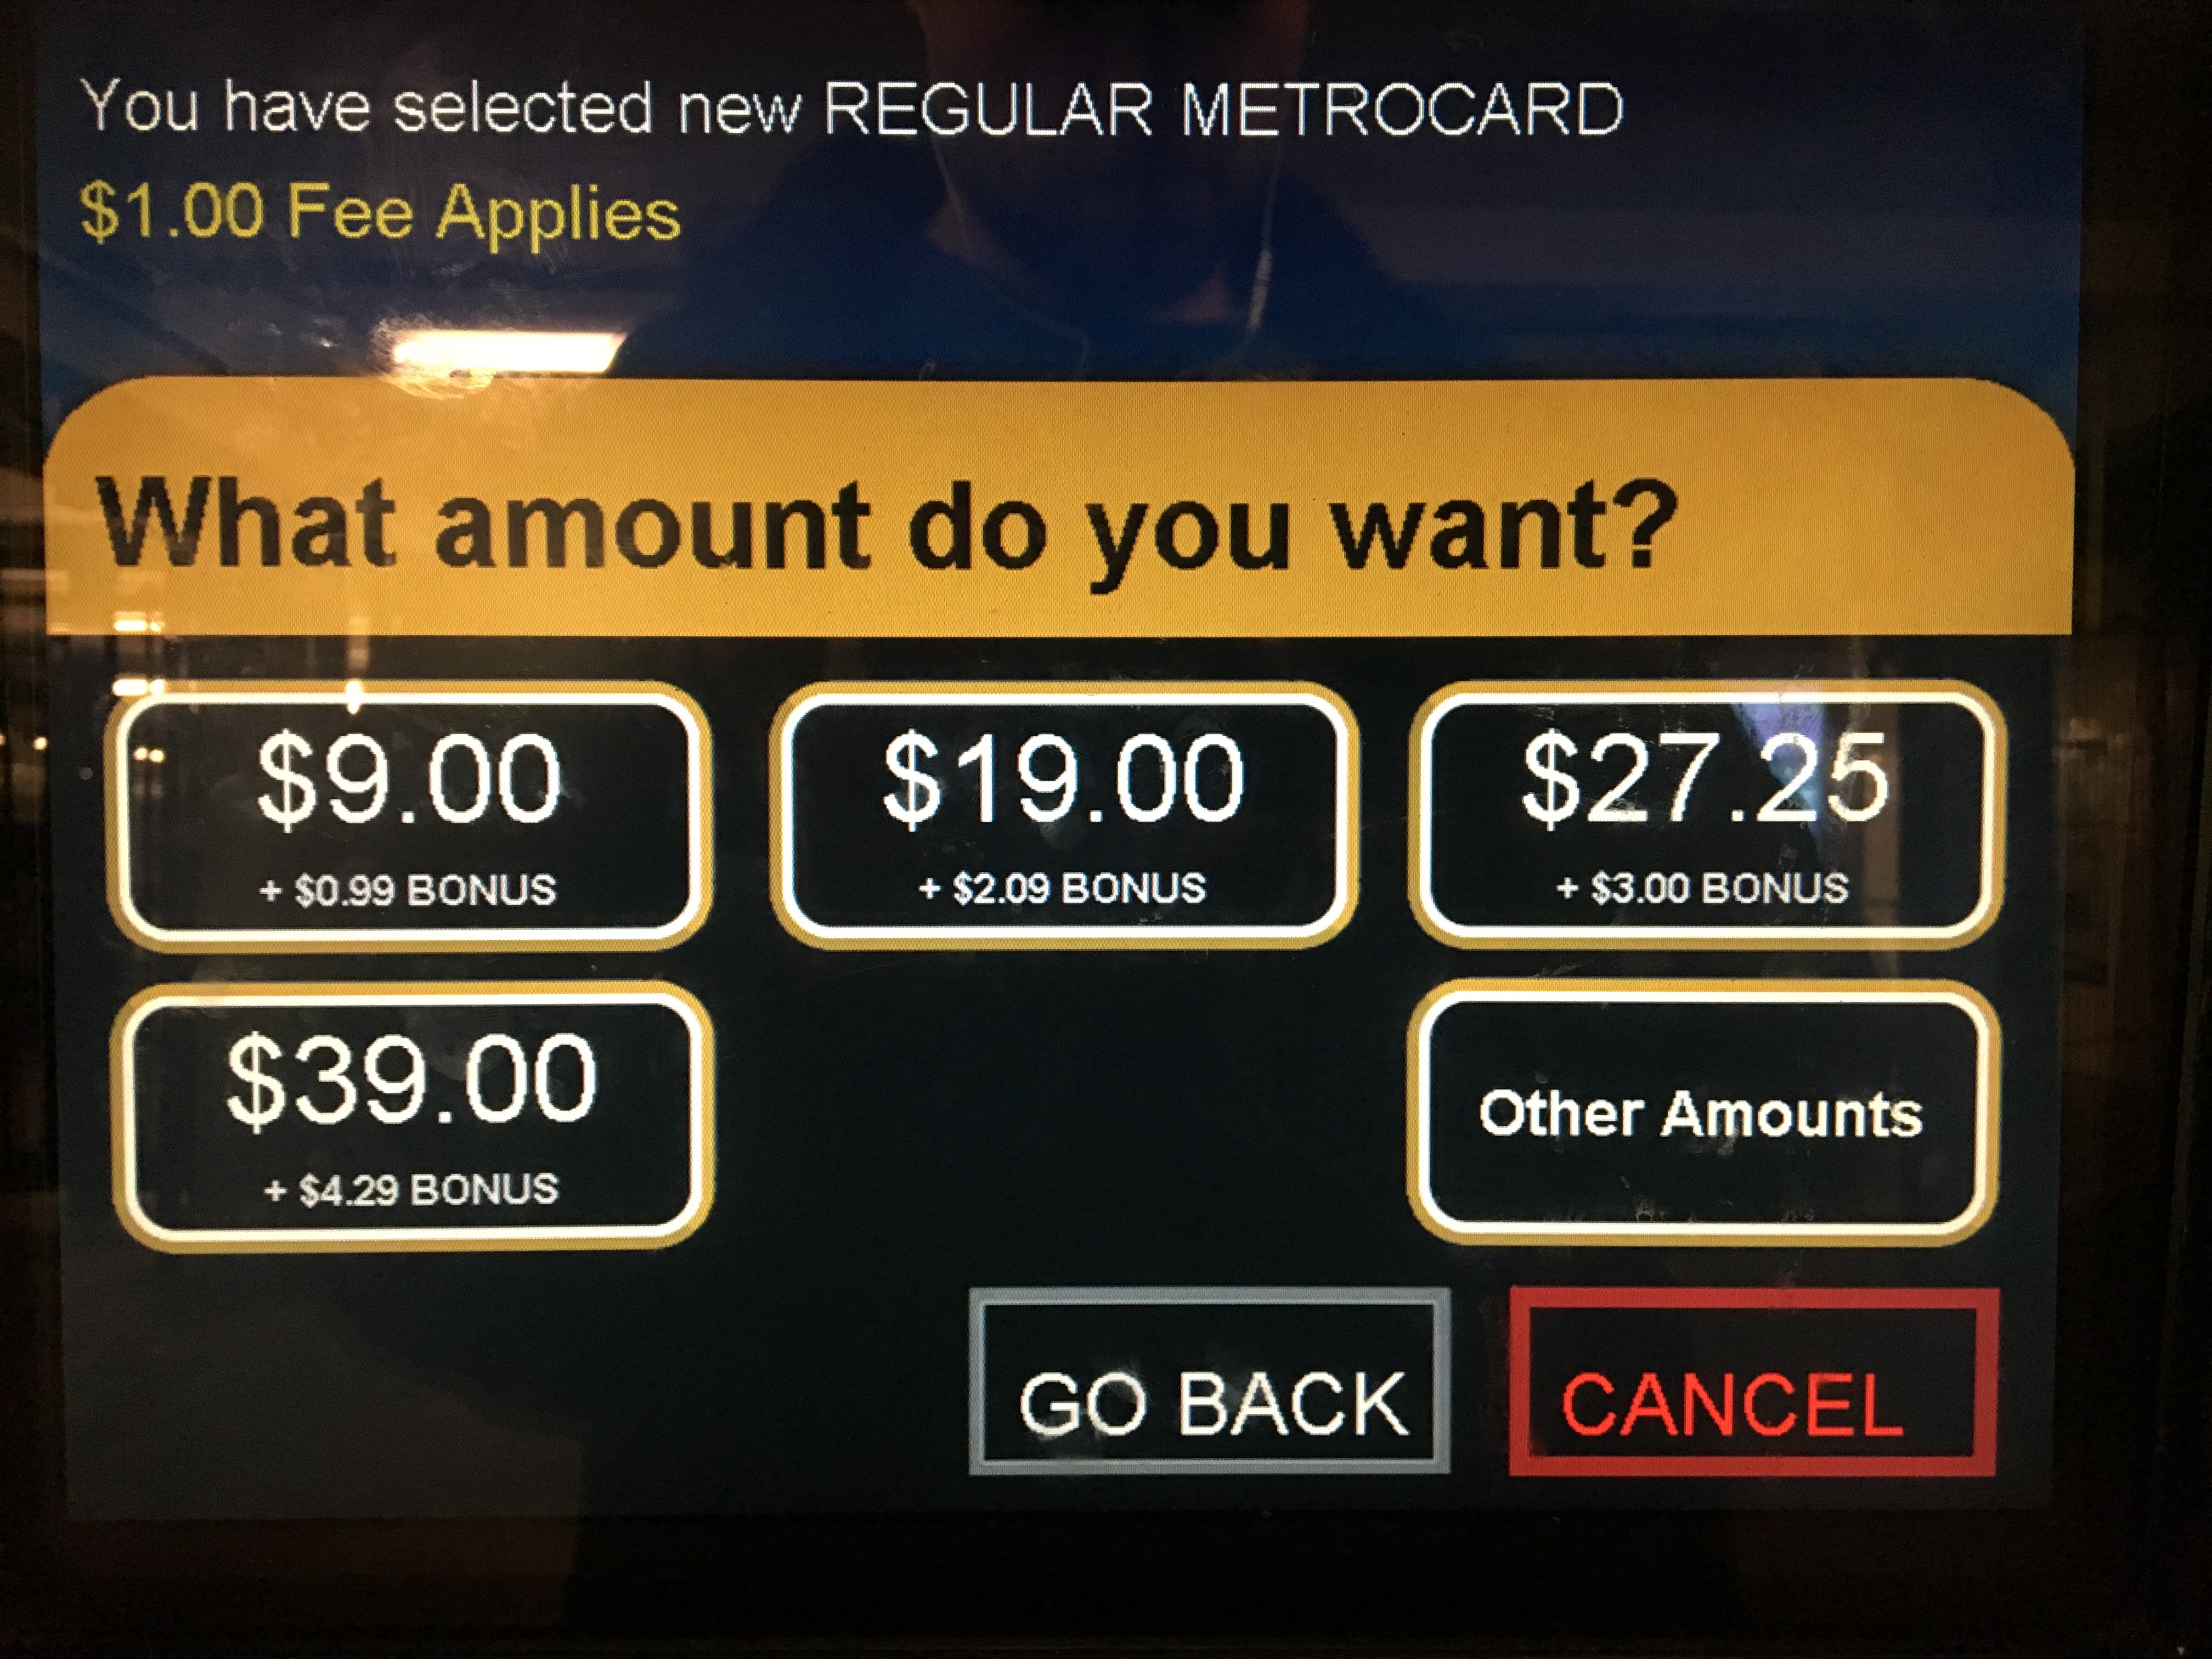 .caption[Image Credit: Richard Dunks (own work), [CC BY-SA 4.0 International](http://creativecommons.org/licenses/by-sa/4.0/)] Source: http://iquantny.tumblr.com/post/109078777129/2230-might-just-be-the-new-1905-for-metrocards --- class:center,middle # 10 MIN BREAK --- # Your Turn  -- + Working in groups, we're going to come up with an interesting/important problem related to 311 Service Request data -- + We're going to use the [brainstorming method](http://designkit.org/methods/1) we've demonstrated -- + And have some fun -- ## .caption[[Image](https://www.flickr.com/photos/andymangold/4455910733/) by [Andy Mangold](https://www.flickr.com/photos/andymangold/), [CC BY 2.0](https://creativecommons.org/licenses/by/2.0/)] --- exclude:true # Your Turn, Part 2 + Working in your group, we're going to put together a process map to work on your question + Follow along --- # Step 1 - Defining the Problem ??? + Students employ the same problem definition approach they used with the 311 exercise to focus on an NYC-specific problem + The intention is for them to utilize the skills we've modeled + Facilitator will seed questions for them to potentially think about --  -- + Think about a key challenge or issue in your agency, that, if solved, could have an impact -- + Find something that interests you -- + .green[**Don't let the available data limit your exploration of the challenge**] --- # Step 2 - Defining the Outcome -- + What will come out of your exploration of this problem? -- + How does it relate to your question/challenge? -- + How will the outcome benefit decision-makers (like yourselves)? --- # Step 3 - Defining the Outcome Measures -- + How will we know we've made an impact? -- + What outputs do we expect to see? -- + How will we tell the story of what we've done? --- # Step 4 - Defining the Inputs -- + What sources of information can you use for this problem? -- + What other inputs might you need (buy-in, interviews, etc) -- + What is the relative priority of these to your project? --- # Step 5 - Outlining the Process -- + What are the steps to create our outcome? -- + What is the best order of steps? -- + How granular do we need to break this down for clarity? --- class:center,middle # Take Some Time To Refine What You Have --- class:center,middle # What Do You Have? --- class:center,middle # WRAP-UP --- # What We've Covered Today -- + Problem Ideation -- + Process Mapping -- + Types of Analysis -- + What else? --- # Resources -- + [Trello](https://trello.com/) - Free project management tool -- + [Asana](https://asana.com/) - Free project management tool -- + [IDEO Design Kit](http://www.designkit.org/methods) - List of various Design Thinking techniques and approaches -- + [Data Science Cheatsheet](https://github.com/govex/Data-Science) - Includes various terms and concepts related to data science -- + Carl Anderson [_Creating a Data-Driven Organization_](http://shop.oreilly.com/product/0636920035848.do) -- + DJ Patil & Hilary Mason [_Data Driven: Creating a Data Culture_](https://www.oreilly.com/ideas/data-driven) -- + [Copy of today's handout](workbook_day1.pdf) -- + [Datapolitan training classes](http://training.datapolitan.com/) --- ## .center[Contact Information] ### Elizabeth DiLuzio <ul> <li style="font-size:35px"> Email: elizabeth[at]datapolitan[dot]com </li> <li style="font-size:35px"> Twitter: <a href="https://twitter.com/lizdiluzio">@lizdiluzio</a> </li> </ul> ### Elana Shneyer <ul> <li style="font-size:35px"> Email: elana[at]datapolitan[dot]com </li> </ul> --- class:center, middle #THANK YOU! --- name:day2 class:center,middle # Welcome Back! ## [Skip to Day 1](#day1) --- # A Reminder of Our Ground Rules -- + Step up, step back -- + Be curious and ask questions! -- + Assume noble regard and positive intent -- + Respect multiple perspectives -- + Listen deeply -- + Be present (phone, email, social media, etc.) --- # Agenda for Day 2 + 9:50 – Introduction to Open Data + 10:15 - Gallery of Possibilities + 10:45 – 15 min Break + 11:00 – Open Data Exercise + 12:30 – Lunch + 1:00 – Project Work + Presentations + 2:30 – 15 min break + 2:45 - Data-Driven Government + 3:30 – Dismissal --- exclude:true # And those Commissioners...  .center[https://twitter.com/NYC_DOT/status/867778502971592706] --- name:open-data # Definition of Open Data -- > Open data is data that can be freely used, shared and built-on by anyone, anywhere, for any purpose ## - [Open Knowledge International](http://blog.okfn.org/2013/10/03/defining-open-data/) --- # Key Features of Open Data -- + Availability and access -- + Reuse and redistribution -- + Universal participation --- # Open Data Benefits -- + Transparency -- + Releasing social and commercial value -- + Participation and engagement --- # Keeping NYC Accountable on Parking Tickets  .caption[Image Credit: Parking Violator by [Atomische * Tom Giebel](https://www.flickr.com/photos/atomische/2299948817/), [CC BY-NC-ND 2.0 ](https://creativecommons.org/licenses/by-nc-nd/2.0/)] .caption[Source: http://iquantny.tumblr.com/post/87573867759/success-how-nyc-open-data-and-reddit-saved-new] --- # Open Data Concerns -- + Privacy (Personally Identifiable Information and Mosaic Effect) -- + Accuracy -- + Security --- # When Good Data Goes Bad  .caption[Image Credit: Kenny Louie, [CC BY 2.0](http://creativecommons.org/licenses/by/2.0), via [Wikimedia Commons](https://commons.wikimedia.org/wiki/File%3ANYC_TAXI_%287038011669%29.jpg)] [Gawker matches Taxi and Limousine Data with Paparazzi Photos](http://gawker.com/the-public-nyc-taxicab-database-that-accidentally-track-1646724546) --- name:gallery # Gallery of Possibilities -- + [A Day in the Life of a NYC Taxi](http://chriswhong.github.io/nyctaxi/) -- + [Living Lots (formerly 596 Acres)](https://livinglotsnyc.org/#11/40.7300/-73.9900) -- + [OpenSewer Atlas](http://openseweratlas.tumblr.com/map) -- + [Twitter NYC: A Multilingual City](http://ny.spatial.ly/) -- + [Pluto Pages](https://plutopages.com/) -- + [Capital Planning Platform](https://capitalplanning.nyc.gov/facilities) -- + [NYC DCP Community District Portals](https://communityprofiles.planning.nyc.gov/) -- + [City of Denton, TX Dashboard](http://data.cityofdenton.com/showcase)<br> -- + [MTA Subway Station Status Interactive Map](http://www.datapolitan.com/mta_station_repair_status/) --- class:center,middle # Link to NYC Open Data Portal for Exercise ## <a href="https://data.cityofnewyork.us/" target="_blank">NYC Open Data Portal</a> --- # Data for Exercise  #### [Click to download if you have problems](data/20160101_20160331_311NoiseContains.csv) --- # 5 Data Analytics Tasks -- 1. Sorting -- 2. Filtering -- 3. Aggregating (PivotTable) -- 4. Manipulating -- 5. Visualizing --- # 1. Sorting -- + Reorganize rows in a dataset based on the values in a column -- + Can sort on multiple columns --- # Sorting by Date  --  --- # Sorting by Date   --- # Sorting by Date  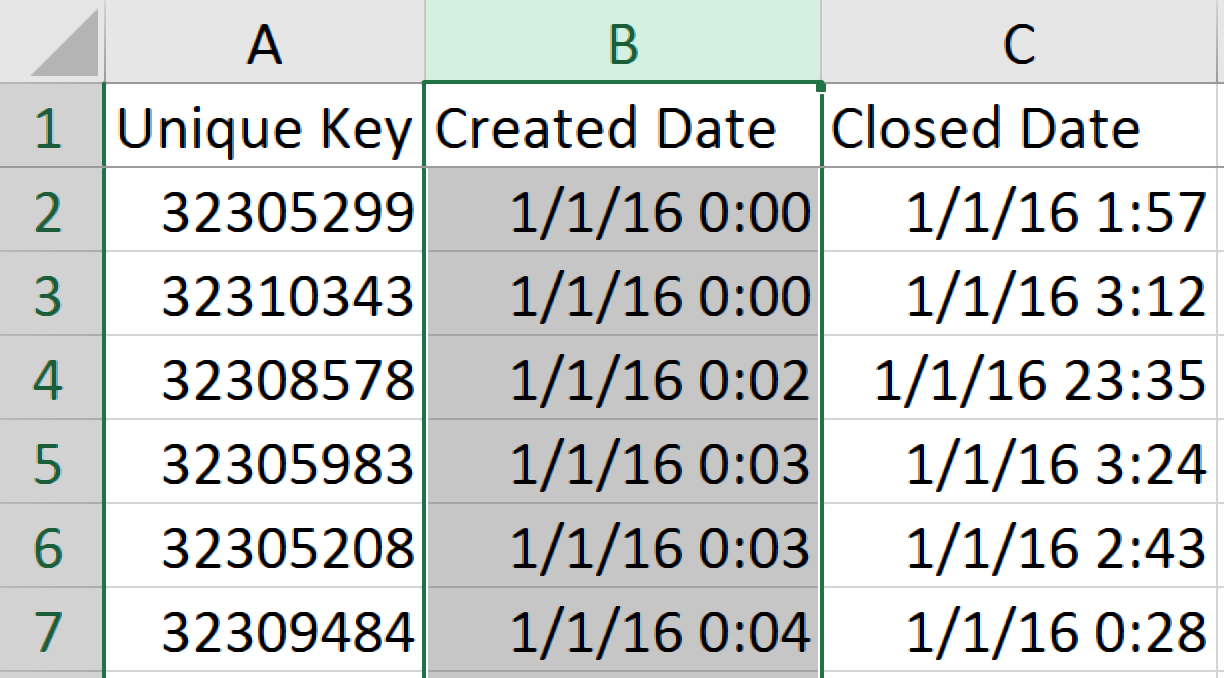 --- # 2. Filtering -- + Only show rows that contain some value -- + Can filter by multiple values -- + Can filter by values in multiple columns --- # Filtering by Agency Name 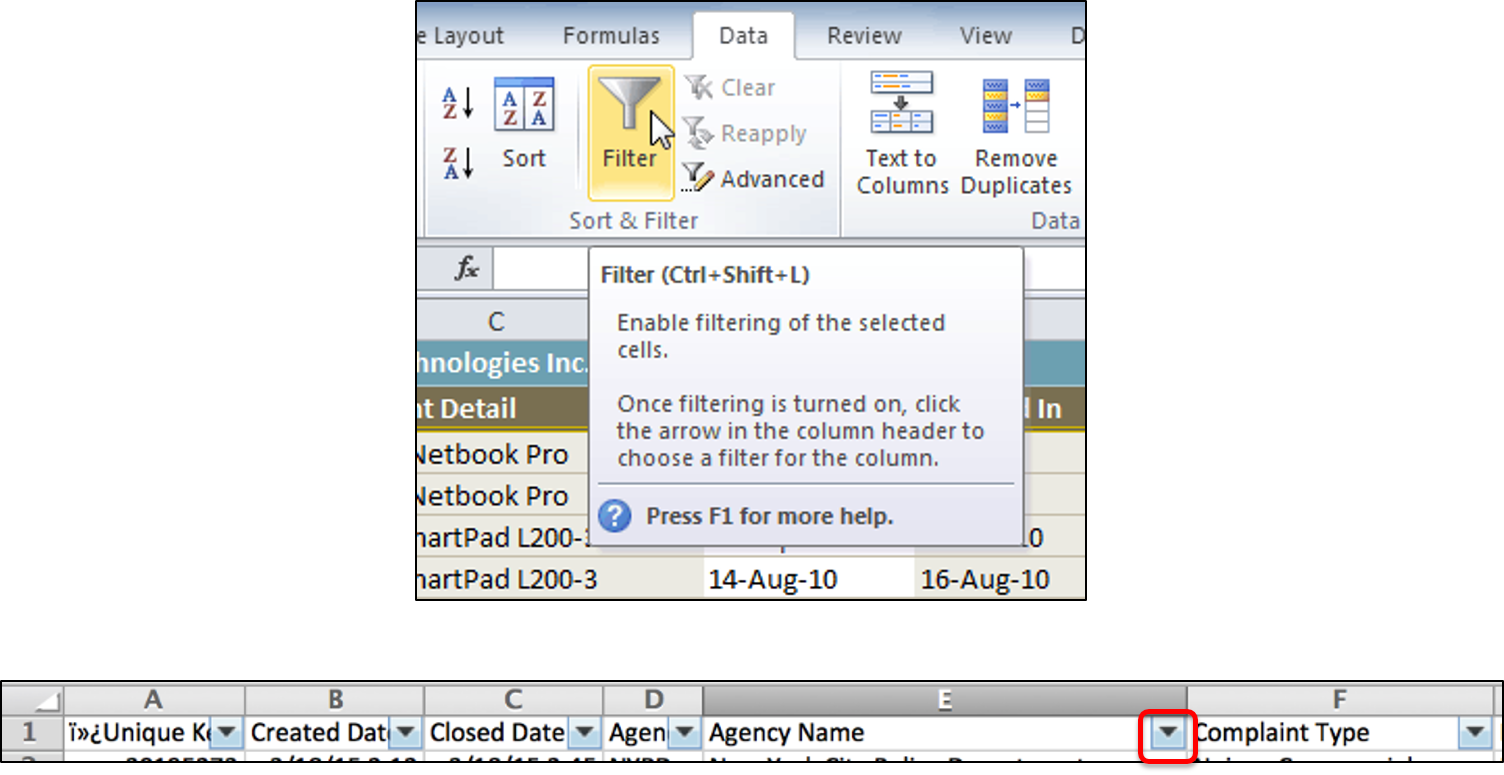 --- # Filtering by Agency Name 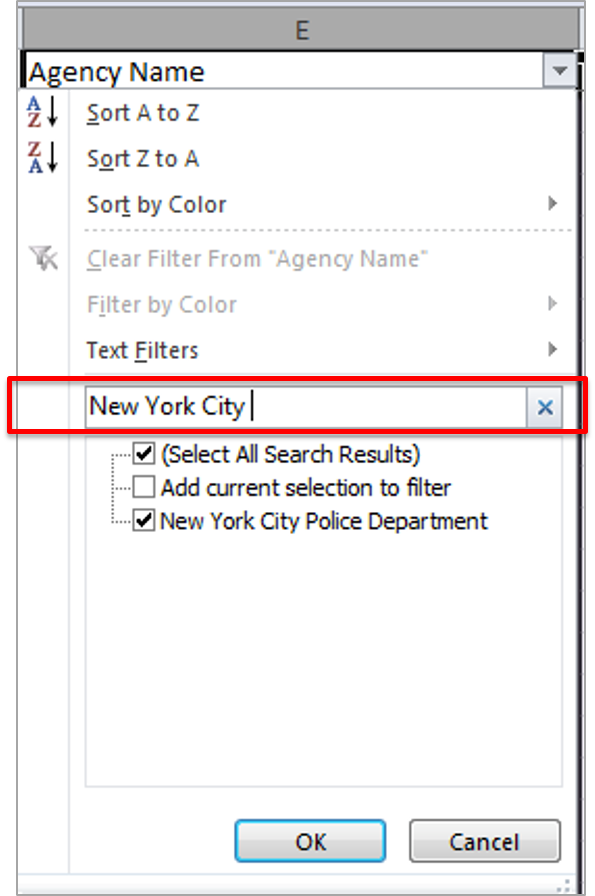 --- # 3. Aggregating Data -- + Trends only become clear in aggregate -- + Often where you discover the "so what" -- + Aggregating data meaningfully can be tricky --- # PivotTables -- + A data summarization tool -- + Useful to quickly understand data -- + Can use to graph data totals -- 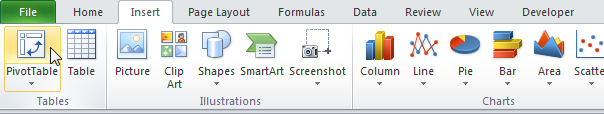 --- # Creating a PivotTable 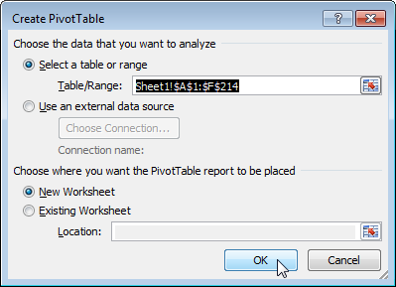 -- + Should default to all your data .red[unless you have any cells selected] -- + Should default to a new worksheet --- # Creating a PivotTable 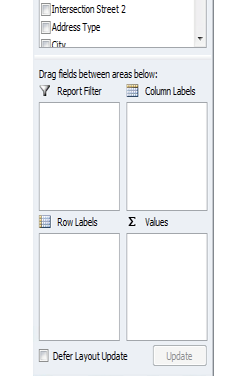 ## Drag and drop fields to visualize + Row labels + Values + Filter + Column Labels --- # Creating a PivotTable 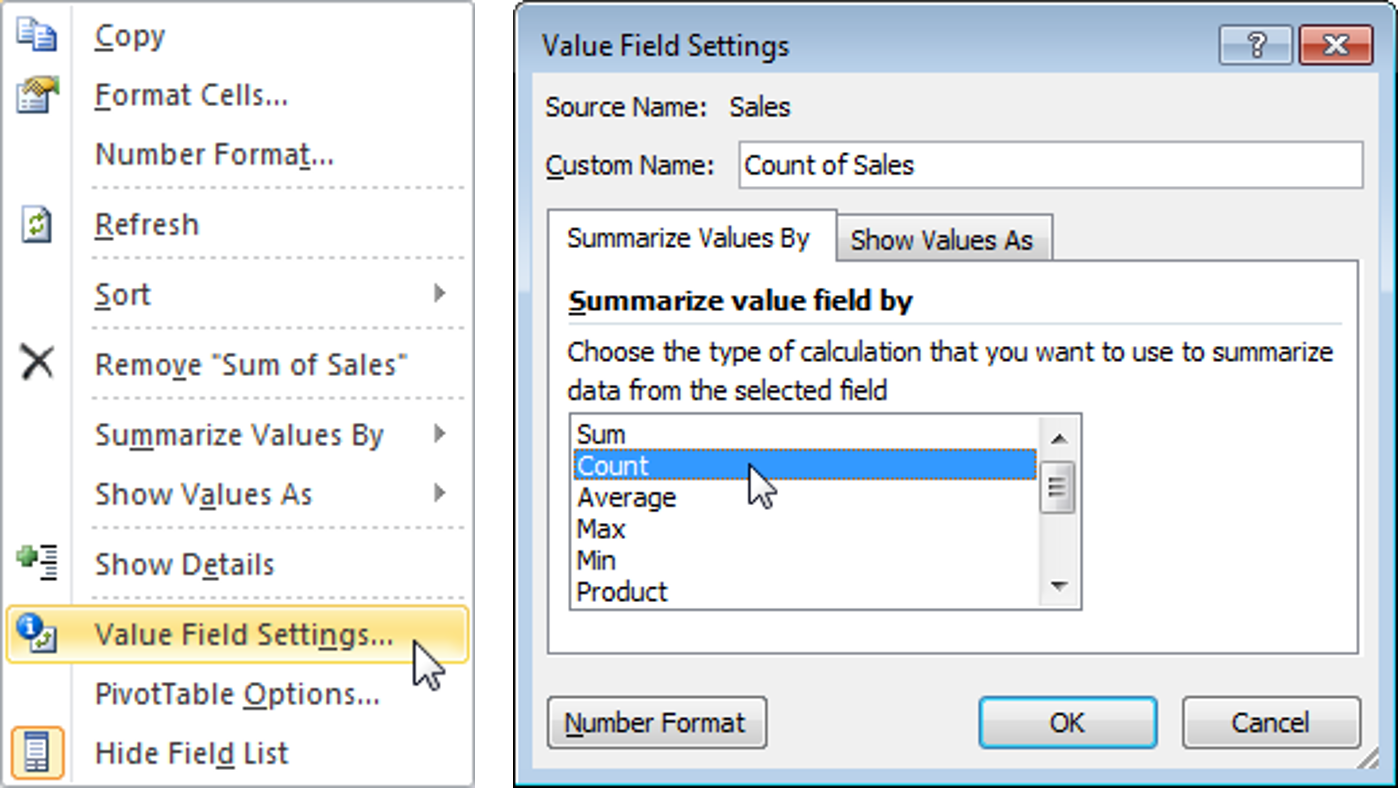 --- # 4. Manipulating Data (In a good way...) -- + Sometimes available categories don't make sense -- + Values may not be in the format you need (or have mistakes) -- + You always want to have a clean copy of the data to go back to -- + Best to keep track of what you've done --- # Extracting Hour From Timestamp -- 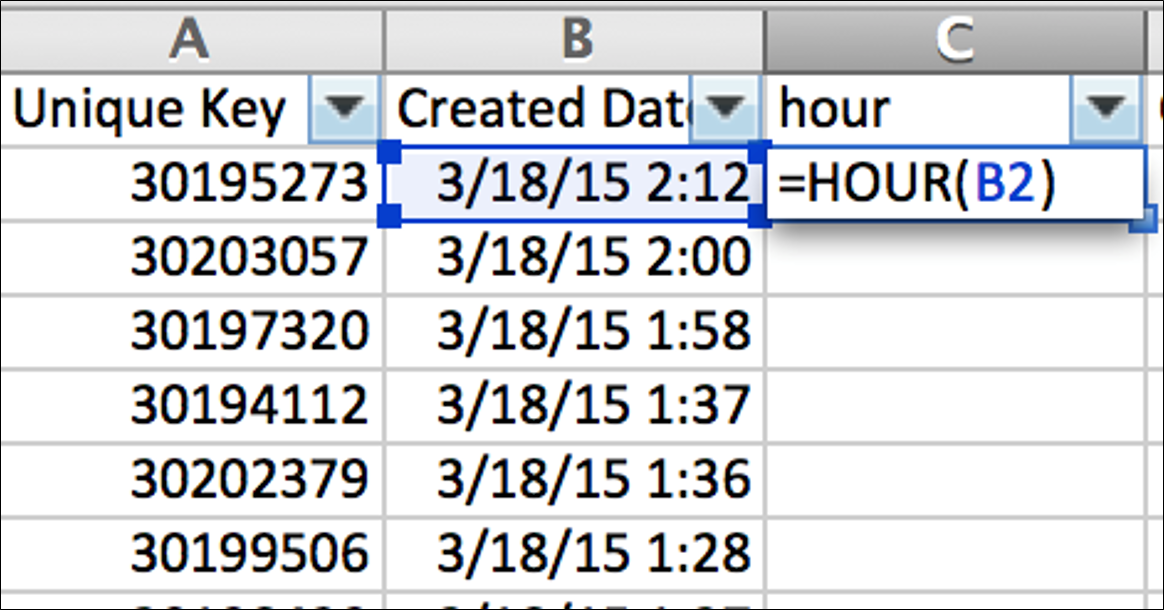 --- class:middle,center [](https://support.office.com/en-us/article/HOUR-function-e2833b50-0db0-499b-acc5-e9ae03de8fbb) --- # Extracting Hour From Timestamp  --- # Extracting Hour From Timestamp  --- # Extracting Hour From Timestamp  --- # Extracting Hour From Timestamp  --- # Extracting Hour From Timestamp  --- # Extracting Hour From Timestamp  --- # 5. Visualizing Data -- + Quickly communicate information -- + Tell a clearer story -- + A picture is worth a thousands words --- class:center,middle # When Are Noise Complaints Received?  --- # Charting Noise Complaints by Hour  + Refresh PivotTable --- # Charting Noise Complaints by Hour  + Refresh PivotTable + Find `Hour` and add it to "Rows" --- # Charting Noise Complaints by Hour + Refresh PivotTable + Find `Hour` and add it to "Rows" + Style the chart  --- exclude:true # Finding Context  --- # Exploratory Data Analysis -- + Goal -> Discover patterns in the data -- + Understand the context -- + Summarize fields -- + Use graphical representations of the data -- + Explore outliers -- ####Tukey, J.W. (1977). Exploratory data analysis. Reading, MA: Addison-Wesley --- # Exploring the Data ??? + Facilitator releases participants to explore the data on their own + Facilitator helps participants with any issues analyzing the data + Participants practice presentation skills and articulating their analysis to a group + Facilitators emphasize telling a story with data -- + Take a moment to find something interesting in the data -- + Work in pairs, groups, or on your own -- + Be prepared to share what you found and the steps you took to find it -- + We'll be around to help --- # What Did You Find? <iframe src="https://giphy.com/embed/l0HlRnAWXxn0MhKLK" width="480" height="348" frameBorder="0" class="giphy-embed" allowFullScreen></iframe><p><a href="https://giphy.com/gifs/book-library-literacy-l0HlRnAWXxn0MhKLK">via GIPHY</a></p> --- class:center,middle # Presentations --- class:center,middle # LUNCH  [Source](https://xkcd.com/1445/) --- class:center,middle # Welcome Back! --- # Let's Get Back to Our Group Plans ??? + Facilitator reviews the work with groups and prepares them to map the process + Facilitator builds on the experience of the morning working with the group map + Facilitator allows as much time as is necessary for groups to come to some sense of the process they want to follow -- + Take a moment to look them over -- + Remind yourselves of the great work you did -- + Get ready for the final step in the planning process: -- ## Figuring out how you're going to accomplish the work --- # Step 5 - Outlining the Process -- + What are the steps to create our outcome? -- + What is the best order of steps? -- + How granular do we need to break this down for clarity? --- # Now Work Your Plan <iframe src="https://giphy.com/embed/Dps6uX4XPOKeA" width="480" height="366" frameBorder="0" class="giphy-embed" allowFullScreen></iframe><p><a href="https://giphy.com/gifs/funny-nickelodeon-bob-esponja-Dps6uX4XPOKeA">via GIPHY</a></p> --- # Exercise -- + Go through and work through the process as best you can -- + Do what you can in the time you have -- + We'll be around to help -- + [Click to submit your work](https://script.google.com/a/macros/datapolitan.com/s/AKfycbwMcE5pcJwZHdbSCN_2epwaXnRLSRPaLbHCAhxaZJ79UXaRpQ_l/exec) ??? + Give class approx 40 minutes to create their presentations and submit their work --- class:center,middle # Presentations --- class:center,middle # 15 MIN BREAK  [Source](https://xkcd.com/1232/) --- name:ddc class:center,middle # BUILDING A DATA-DRIVEN CULTURE --- # Data Driven Culture  --- # Data Driven Culture  --- # Data Driven Culture  --- # Data Driven Culture  --- # Data Driven Culture  --- # Data Driven Culture  --- # Data Driven Culture  --- # Data Driven Culture  --- # Data Driven Culture  --- # Data Driven Culture  --- # Data Driven Culture  --- # Data Driven Culture > “Do you have data to back that up?” should be a question that no one is afraid to ask (and everyone is prepared to answer) ## - Julie Arsenault [Source](https://www.pagerduty.com/blog/how-to-create-a-data-driven-culture/) --- exclude:true # Links to Other Open Data Portals + New York State - https://data.ny.gov + US Federal Government - https://www.data.gov/ --- exclude:true class:center,middle # Working with Open Data ## [Download this data](data/311_Noise_20150601_20150830.csv) --- exclude:true class:center,middle # [Click to Download<br>NYC Population Data 1970 - 2010](data/NYC_Population_1970-2010_formatted.xlsx) --- class:center,middle # Wrap-Up --- exclude:true # Final Thoughts + Data tells a story + Data is only as good as the decisions it enables + Data is a strategic asset to the organization + Data doesn't speak for itself + Analysis is the search for understanding --- # What We've Covered Today -- + Open Data -- + Working with data -- + What else? --- # Resources -- + [Microsoft Office Help](http://office.microsoft.com/en-us/support/) - Support for MS Office products -- + [Excel Tips](http://excel.tips.net/) - Various tips and tricks for using Excel -- + [IDEO Design Kit](http://www.designkit.org/methods) - List of various Design Thinking techniques and approaches -- + [Trello](https://trello.com/) - Free project management tool -- + [Asana](https://asana.com/) - Free project management tool -- + [Data Science Cheatsheet](https://github.com/govex/Data-Science) - Includes various terms and concepts related to data science -- + Carl Anderson [_Creating a Data-Driven Organization_](http://shop.oreilly.com/product/0636920035848.do) -- + DJ Patil & Hilary Mason [_Data Driven: Creating a Data Culture_](https://www.oreilly.com/ideas/data-driven) -- + [Copy of yesterday's handout](workbook_day1.pdf) / [Copy of today's handout](workbook_day2.pdf) -- + [Datapolitan training classes](http://training.datapolitan.com/) --- # Remember... -- + Data tells a story -- + Where there's a will, there's a way -- + Sometimes you just need to think about your problem differently  --- exclude:true # Homelessness in NYC <iframe width="100%" height="480" frameborder="0" src="https://richard-datapolitan.carto.com/viz/143c4e52-34e7-11e7-91e8-0ef7f98ade21/embed_map" allowfullscreen webkitallowfullscreen mozallowfullscreen oallowfullscreen msallowfullscreen></iframe> --- ## .center[Contact Information] ### Elizabeth DiLuzio <ul> <li style="font-size:35px"> Email: elizabeth[at]datapolitan[dot]com </li> <li style="font-size:35px"> Twitter: <a href="https://twitter.com/lizdiluzio">@lizdiluzio</a> </li> </ul> ### Elana Shneyer <ul> <li style="font-size:35px"> Email: elana[at]datapolitan[dot]com </li> </ul> --- class:center, middle #THANK YOU!